QUESTION IMAGE
Question
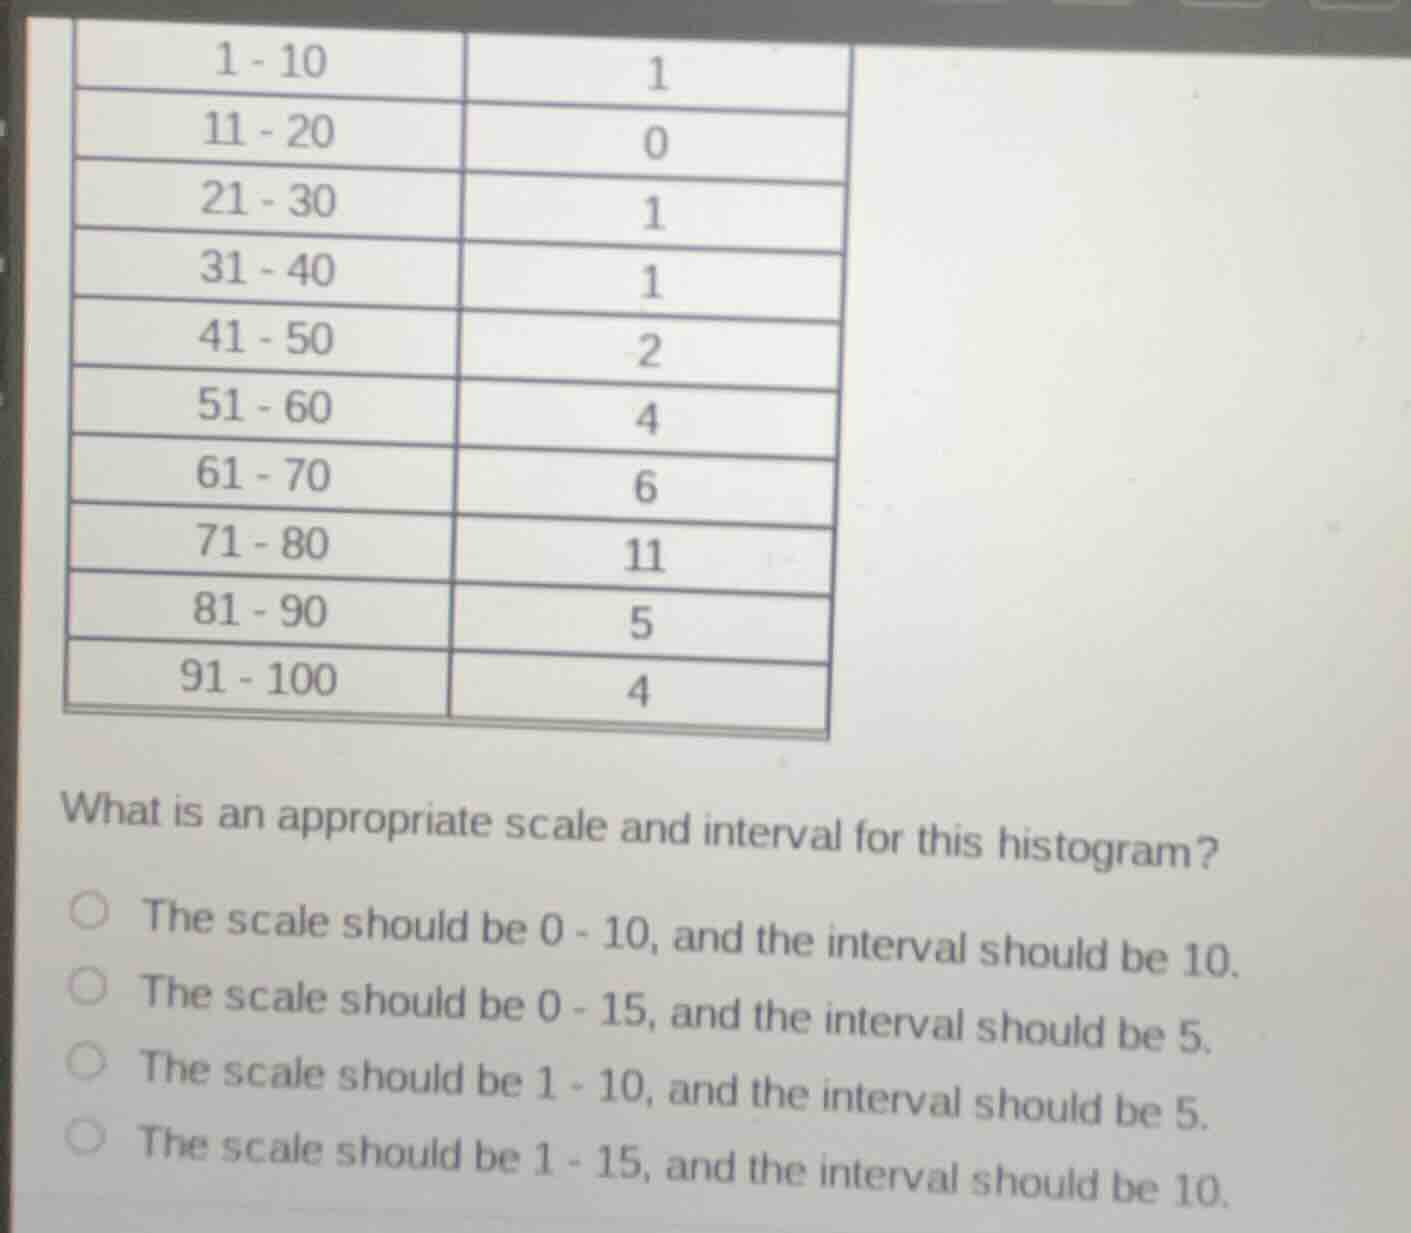
1 - 10 1
11 - 20 0
21 - 30 1
31 - 40 1
41 - 50 2
51 - 60 4
61 - 70 6
71 - 80 11
81 - 90 5
91 - 100 4
what is an appropriate scale and interval for this histogram?
the scale should be 0 - 10, and the interval should be 10.
the scale should be 0 - 15, and the interval should be 5.
the scale should be 1 - 10, and the interval should be 5.
the scale should be 1 - 15, and the interval should be 10.
Brief Explanations
- First, identify the maximum frequency in the data: the highest frequency is 11. The scale needs to cover this maximum value, so it should go at least to 11.
- Next, check the class intervals of the original data: each group spans 10 units (1-10, 11-20, etc.), so the horizontal (x-axis) interval for the histogram should match this 10-unit span.
- Evaluate the options:
- Option 1: Scale 0-10 is too small (can't fit the frequency of 11).
- Option 2: Scale 0-15 covers the max frequency 11, and an interval of 5 would misalign with the original 10-unit data groups.
- Option 3: Scale 1-10 is too small, and interval 5 is incorrect.
- Option 4: Scale 1-15 covers the max frequency 11, and interval 10 matches the original data's group span.

Snap & solve any problem in the app
Get step-by-step solutions on Sovi AI
Photo-based solutions with guided steps
Explore more problems and detailed explanations
The scale should be 1 - 15, and the interval should be 10.