QUESTION IMAGE
Question
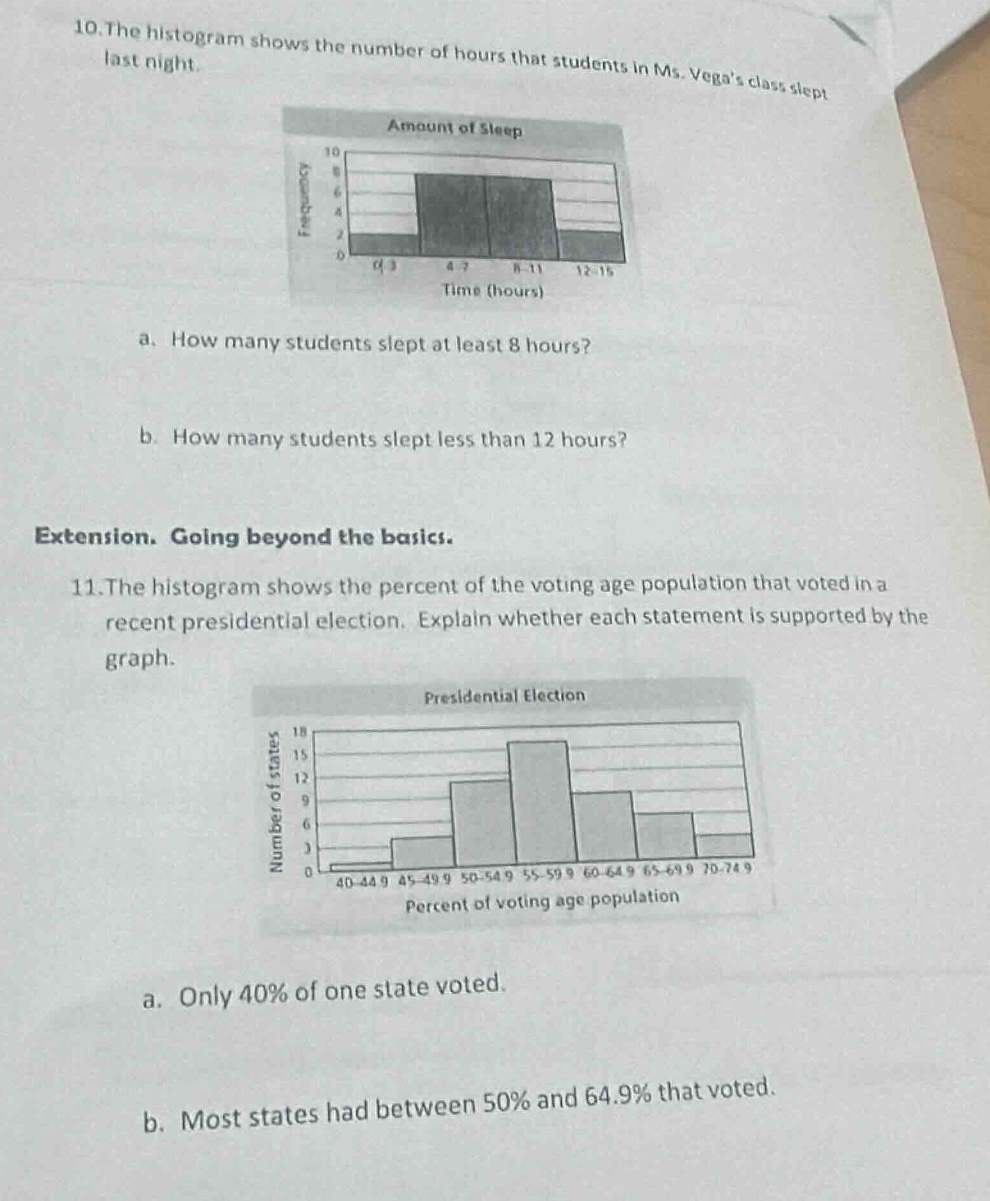
- the histogram shows the number of hours that students in ms. vegas class slept last night.
amount of sleep
a. how many students slept at least 8 hours?
b. how many students slept less than 12 hours?
extension. going beyond the basics.
- the histogram shows the percent of the voting age population that voted in a recent presidential election. explain whether each statement is supported by the graph.
presidential election
a. only 40% of one state voted.
b. most states had between 50% and 64.9% that voted.
Question 10a
Step1: Identify relevant intervals
"At least 8 hours" includes intervals 8 - 11 and 12 - 15.
Step2: Find frequencies
From the histogram, frequency for 8 - 11 is 8, for 12 - 15 is 2.
Step3: Sum frequencies
Total = 8 + 2 = 10.
Step1: Identify relevant intervals
"Less than 12 hours" includes 0 - 3, 4 - 7, 8 - 11.
Step2: Find frequencies
Frequencies: 0 - 3: 2, 4 - 7: 8, 8 - 11: 8.
Step3: Sum frequencies
Total = 2 + 8 + 8 = 18.
The interval 40 - 44.9 has a frequency (number of states) of 1. This means 1 state has a voting percentage in 40 - 44.9%, so it’s possible 40% (within that interval) of one state voted. Thus, the statement is supported.

Snap & solve any problem in the app
Get step-by-step solutions on Sovi AI
Photo-based solutions with guided steps
Explore more problems and detailed explanations
10