QUESTION IMAGE
Question
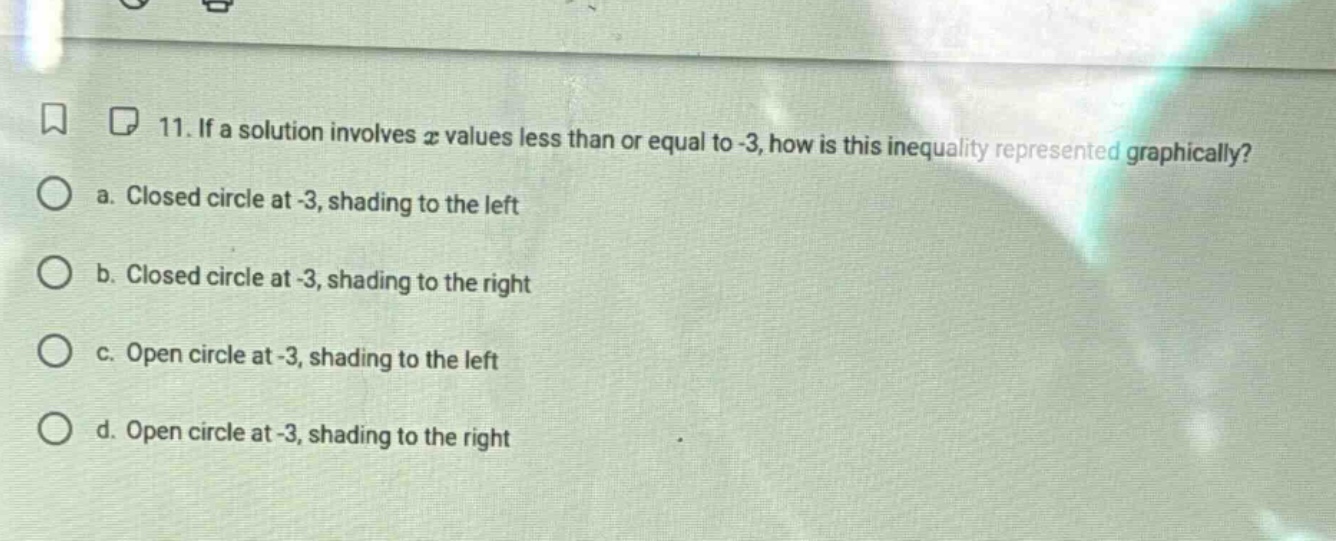
- if a solution involves $x$ values less than or equal to -3, how is this inequality represented graphically?
a. closed circle at -3, shading to the left
b. closed circle at -3, shading to the right
c. open circle at -3, shading to the left
d. open circle at -3, shading to the right
Brief Explanations
- A closed circle is used on a number line when the value is included in the solution (due to the "less than or equal to" condition, so -3 is part of the solution).
- Values less than -3 lie to the left of -3 on a standard number line, so the region to the left is shaded.

Snap & solve any problem in the app
Get step-by-step solutions on Sovi AI
Photo-based solutions with guided steps
Explore more problems and detailed explanations
a. Closed circle at -3, shading to the left