QUESTION IMAGE
Question
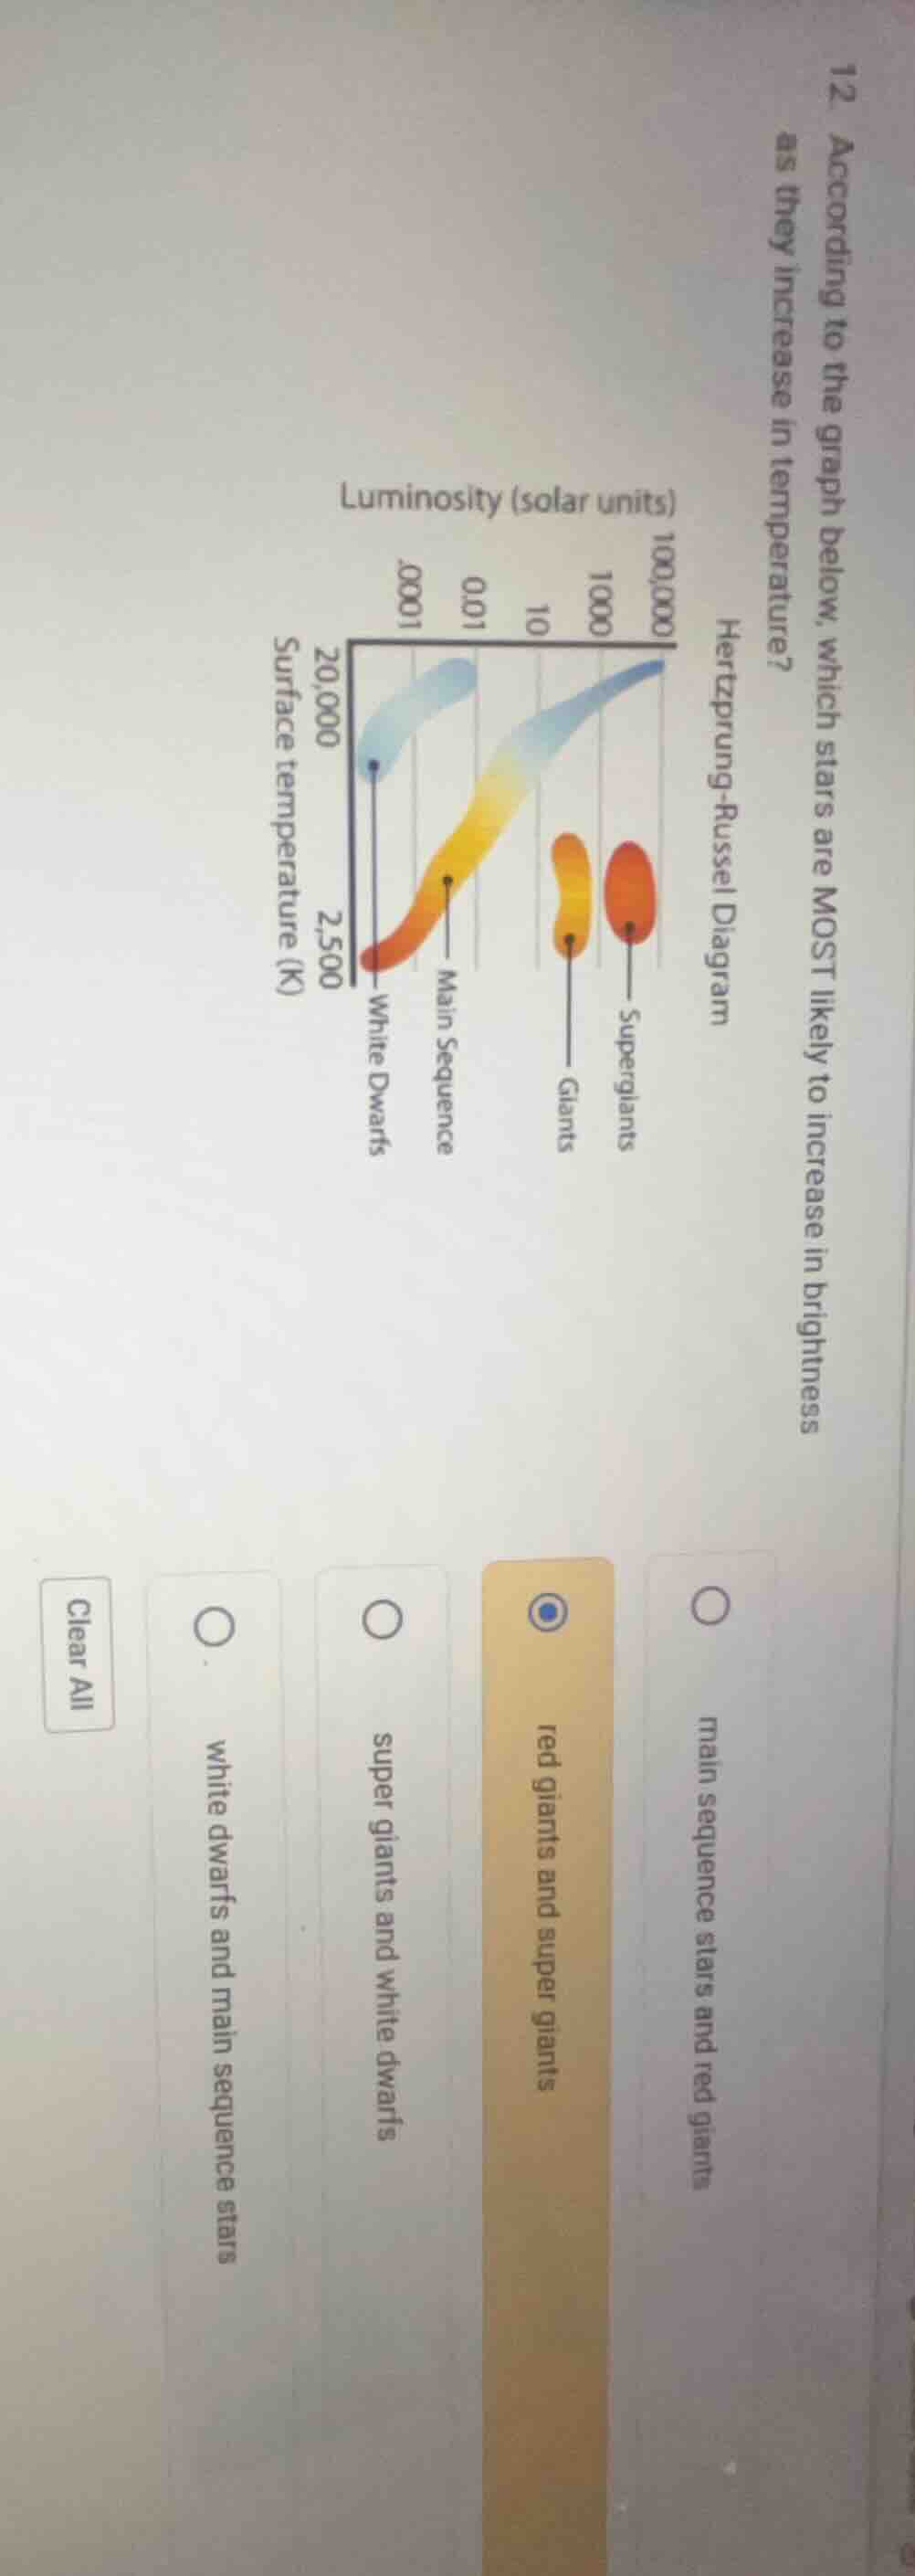
12 according to the graph below, which stars are most likely to increase in brightness as they increase in temperature? hertzprung - russel diagram chart content: luminosity (solar units) on the vertical axis, surface temperature (k) on the horizontal axis, with regions for white dwarfs, main sequence, giants, supergiants options: main sequence stars and red giants; red giants and super giants; super giants and white dwarfs; white dwarfs and main sequence stars
To determine which stars increase in brightness (luminosity) with temperature, we analyze the Hertzsprung - Russell diagram. Red giants and supergiants are in the upper - right region. As temperature (x - axis, though here we consider the trend) increases, their luminosity (y - axis, brightness) also increases. Main sequence stars follow a different trend (luminosity increases with temperature but the question is about the "most likely" and the trend for giants/supergiants in terms of brightness increase with temperature is more pronounced in the context of the options). White dwarfs have low luminosity and their luminosity does not increase with temperature in the same way. Supergiants and white dwarfs: white dwarfs have low luminosity and don't follow the brightness - temperature increase trend. Main sequence stars and red giants: the main sequence trend is different from the clear brightness increase with temperature for red giants and supergiants.

Snap & solve any problem in the app
Get step-by-step solutions on Sovi AI
Photo-based solutions with guided steps
Explore more problems and detailed explanations
red giants and super giants