QUESTION IMAGE
Question
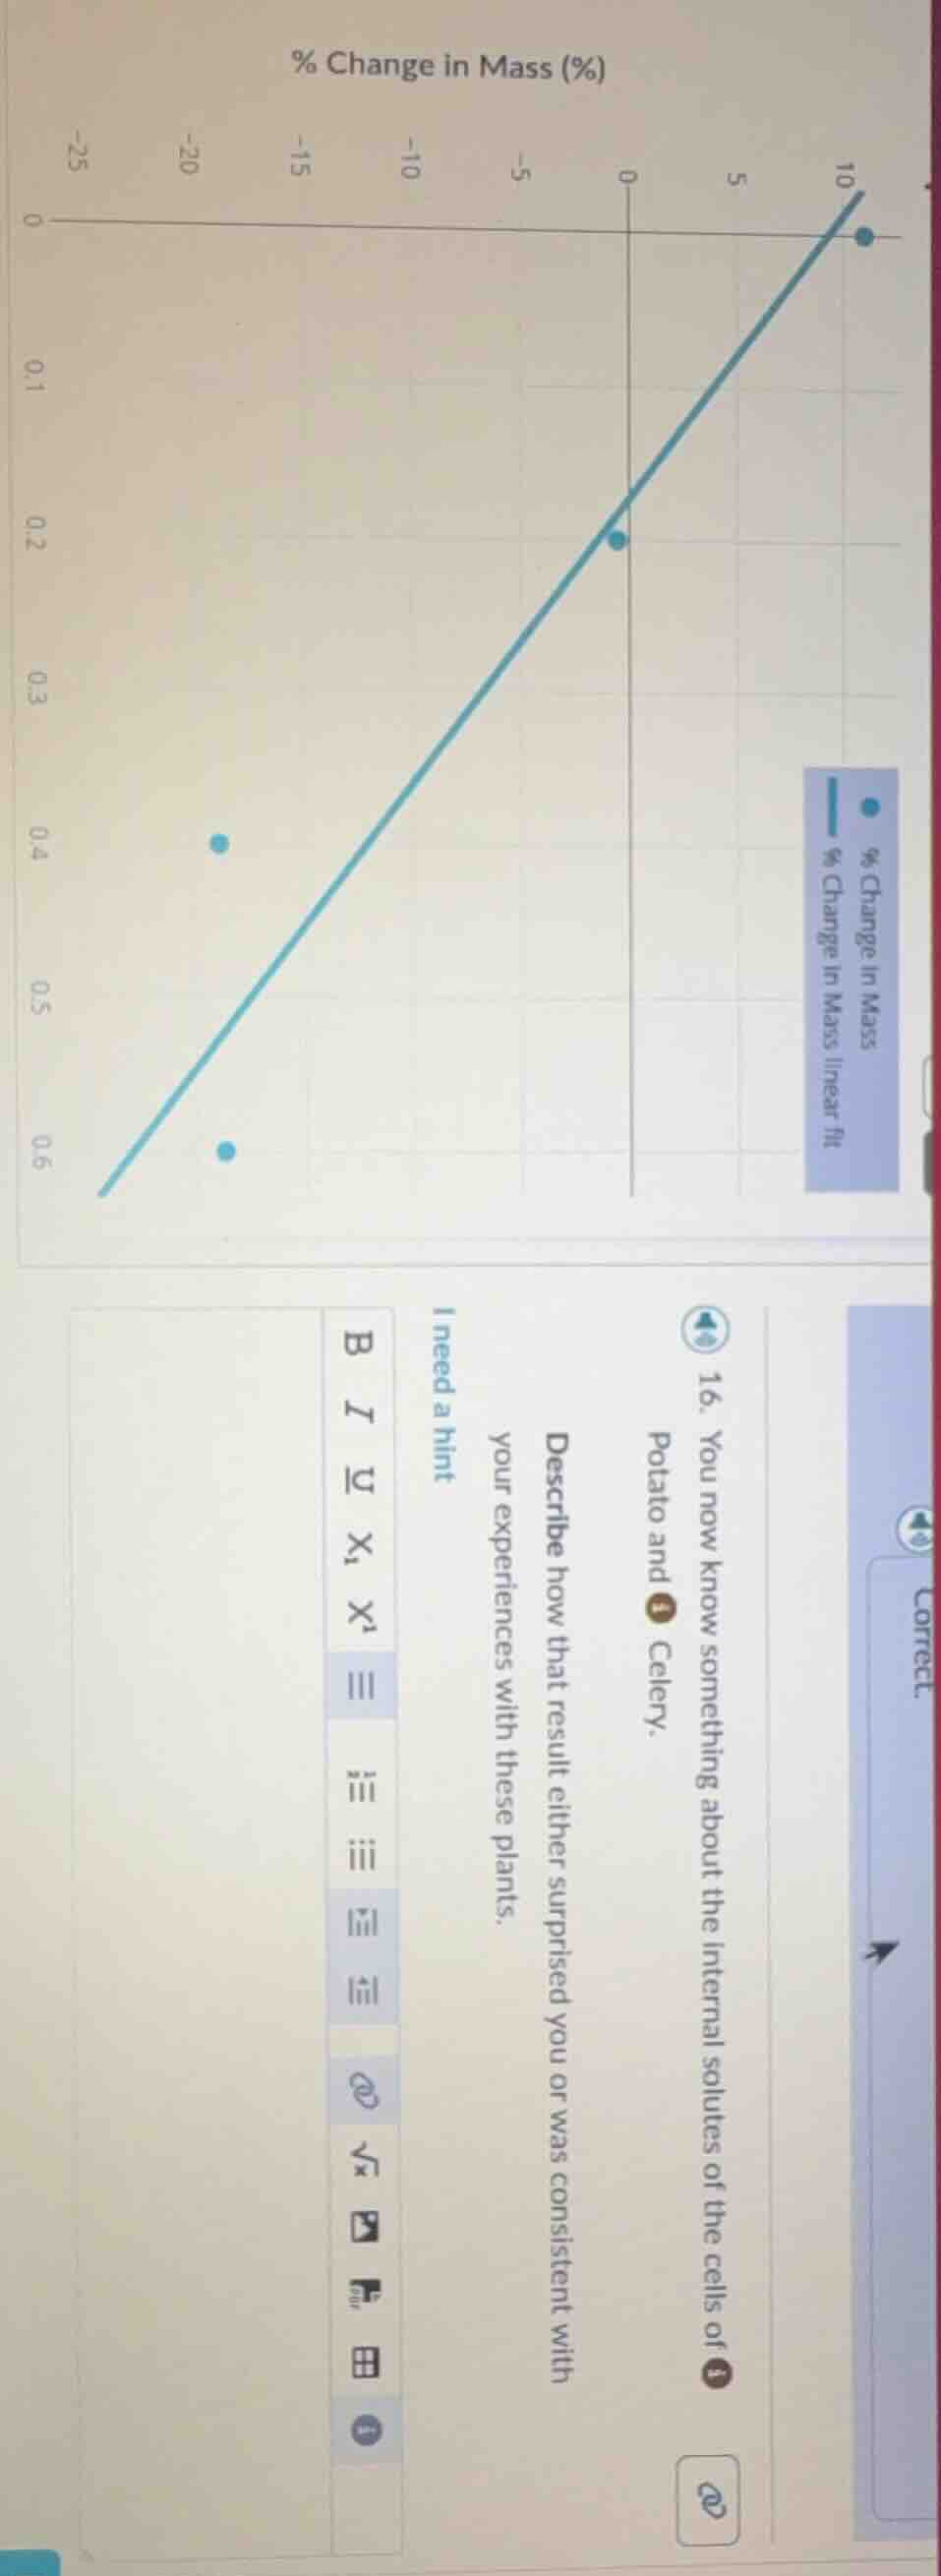
- you now know something about the internal solutes of the cells of potato and celery. describe how that result either surprised you or was consistent with your experiences with these plants.
The graph shows that as the independent variable (likely external solute concentration, not labeled but implied by osmosis experiments) increases, the % change in mass of potato/celery becomes more negative. This matches expected osmosis behavior: when external solute concentration is higher than the plant cell's internal solute concentration, water leaves the cells, causing mass loss (negative % change in mass). The linear fit confirms this inverse relationship, which is consistent with standard osmosis observations in plant cells. If surprised, it might be by the magnitude of mass change or how well the data fits the linear trend, but the core relationship aligns with known plant cell osmosis.

Snap & solve any problem in the app
Get step-by-step solutions on Sovi AI
Photo-based solutions with guided steps
Explore more problems and detailed explanations
The result is consistent with expected osmosis behavior in potato and celery cells: as the external solute concentration (implied by the y-axis variable) increases, the plant cells lose water, leading to a more negative percent change in mass. The linear fit clearly shows this inverse relationship, which matches the principle that water moves to areas of higher solute concentration across a semipermeable membrane. If any surprise occurred, it could be the strong linear correlation of the data points, but the overall trend aligns with standard plant cell osmosis experiments.