QUESTION IMAGE
Question
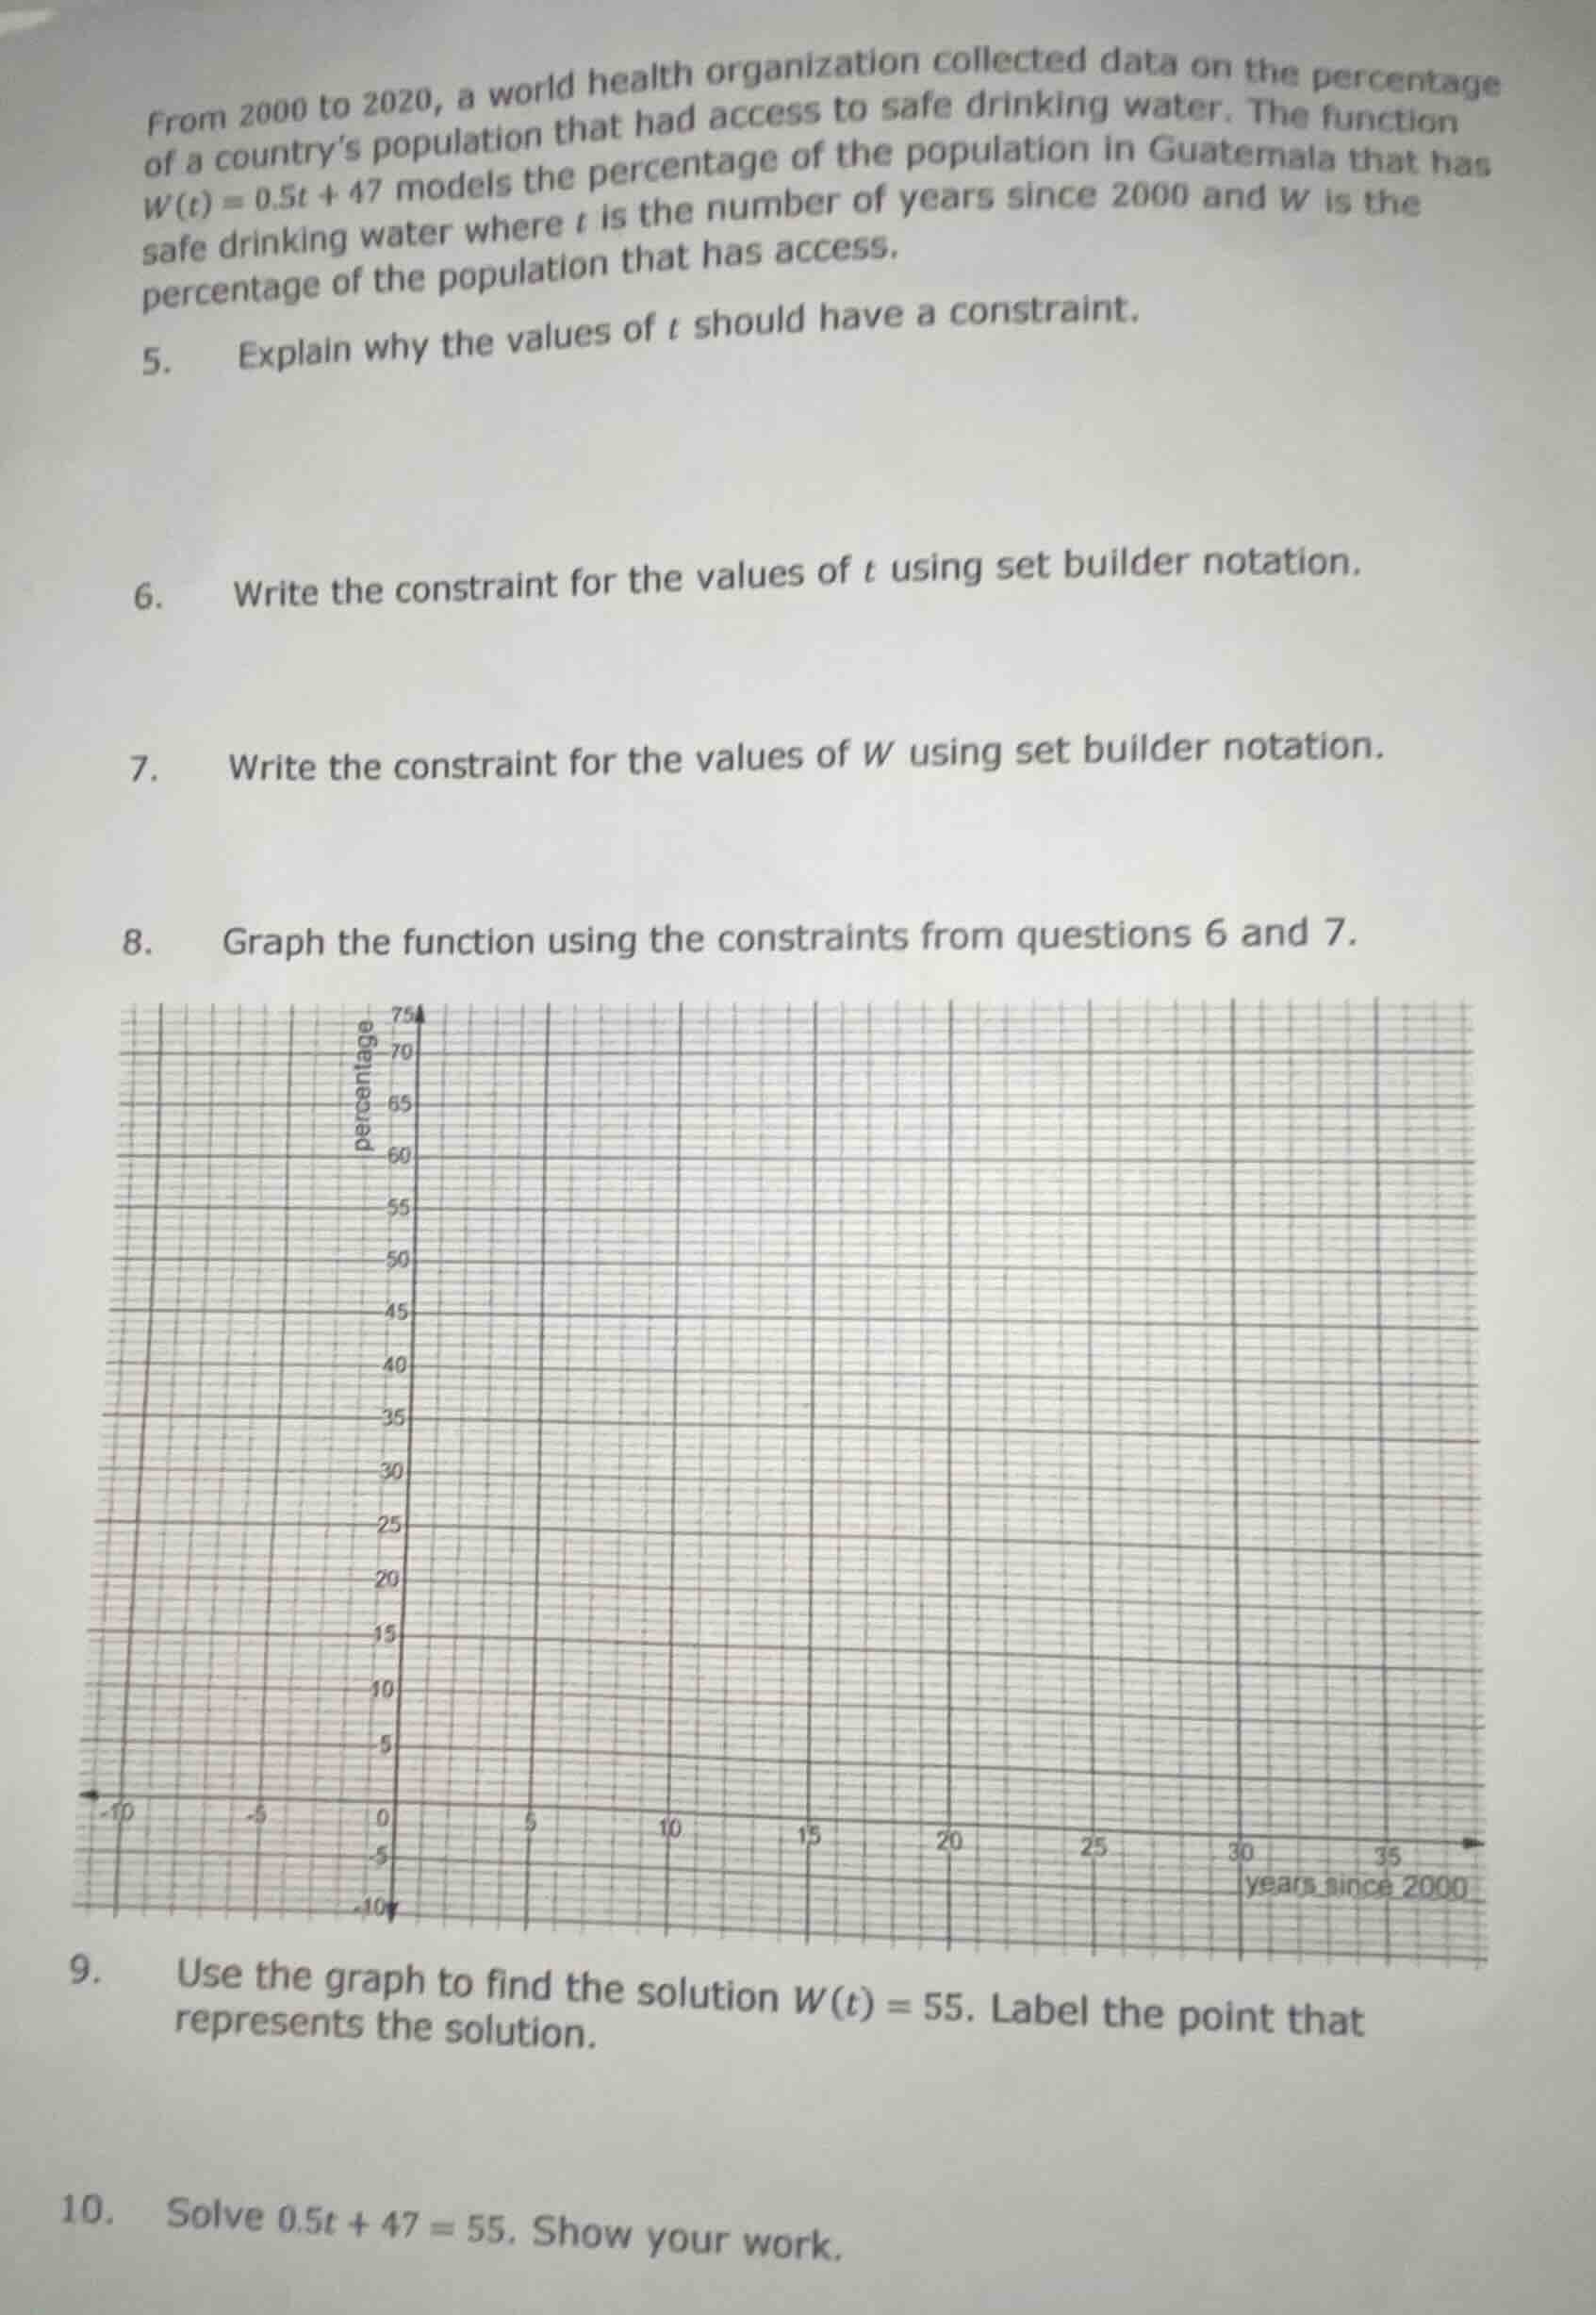
from 2000 to 2020, a world health organization collected data on the percentage of a countrys population that had access to safe drinking water. the function $w(t) = 0.5t + 47$ models the percentage of the population in guatemala that has safe drinking water where $t$ is the number of years since 2000 and $w$ is the percentage of the population that has access.
- explain why the values of $t$ should have a constraint.
- write the constraint for the values of $t$ using set builder notation.
- write the constraint for the values of $w$ using set builder notation.
- graph the function using the constraints from questions 6 and 7.
graph with x-axis labeled years since 2000 and y-axis labeled percentage
- use the graph to find the solution $w(t) = 55$. label the point that represents the solution.
- solve $0.5t + 47 = 55$. show your work.
Step 5: Explain t constraint
The data is only collected from 2000 to 2020, so \(t\) (years since 2000) cannot be negative or exceed 20, as those values fall outside the study period.
Step 6: Set builder for t
Define valid \(t\) values: integers/real numbers between 0 and 20 inclusive.
\(\{ t \mid t \in \mathbb{R}, 0 \leq t \leq 20 \}\)
Step 7: Set builder for W
Find min/max W values:
Step7.1: Calculate min W
Substitute \(t=0\): \(W(0)=0.5(0)+47=47\)
Step7.2: Calculate max W
Substitute \(t=20\): \(W(20)=0.5(20)+47=57\)
Step7.3: Write set notation
\(\{ W \mid W \in \mathbb{R}, 47 \leq W \leq 57 \}\)
Step 8: Graph the function
Step8.1: Identify endpoints
When \(t=0\), \(W=47\) (point \((0,47)\)); when \(t=20\), \(W=57\) (point \((20,57)\)).
Step8.2: Plot and connect
Draw a straight line segment between \((0,47)\) and \((20,57)\) on the given grid, with the x-axis labeled "years since 2000" and y-axis labeled "percentage".
Step 9: Graph solution for W(t)=55
Step9.1: Locate W=55 on y-axis
Find the horizontal line at \(W=55\), then find its intersection with the graphed segment.
Step9.2: Identify the point
The intersection point is \((16,55)\); label this point on the graph.
Step10: Solve algebraically
Step10.1: Subtract 47 from both sides
\(0.5t + 47 - 47 = 55 - 47\)
\(0.5t = 8\)
Step10.2: Divide by 0.5
\(t = \frac{8}{0.5}\)
\(t = 16\)

Snap & solve any problem in the app
Get step-by-step solutions on Sovi AI
Photo-based solutions with guided steps
Explore more problems and detailed explanations
- The function only models data collected from 2000 to 2020, so \(t\) must be within the range of years corresponding to this period (cannot be negative or greater than 20).
- \(\{ t \mid t \in \mathbb{R}, 0 \leq t \leq 20 \}\)
- \(\{ W \mid W \in \mathbb{R}, 47 \leq W \leq 57 \}\)
- A line segment connecting the points \((0, 47)\) and \((20, 57)\) on the provided grid (x-axis: years since 2000, y-axis: percentage).
- The solution is the point \((16, 55)\) on the graphed line segment.
- \(t = 16\)