QUESTION IMAGE
Question
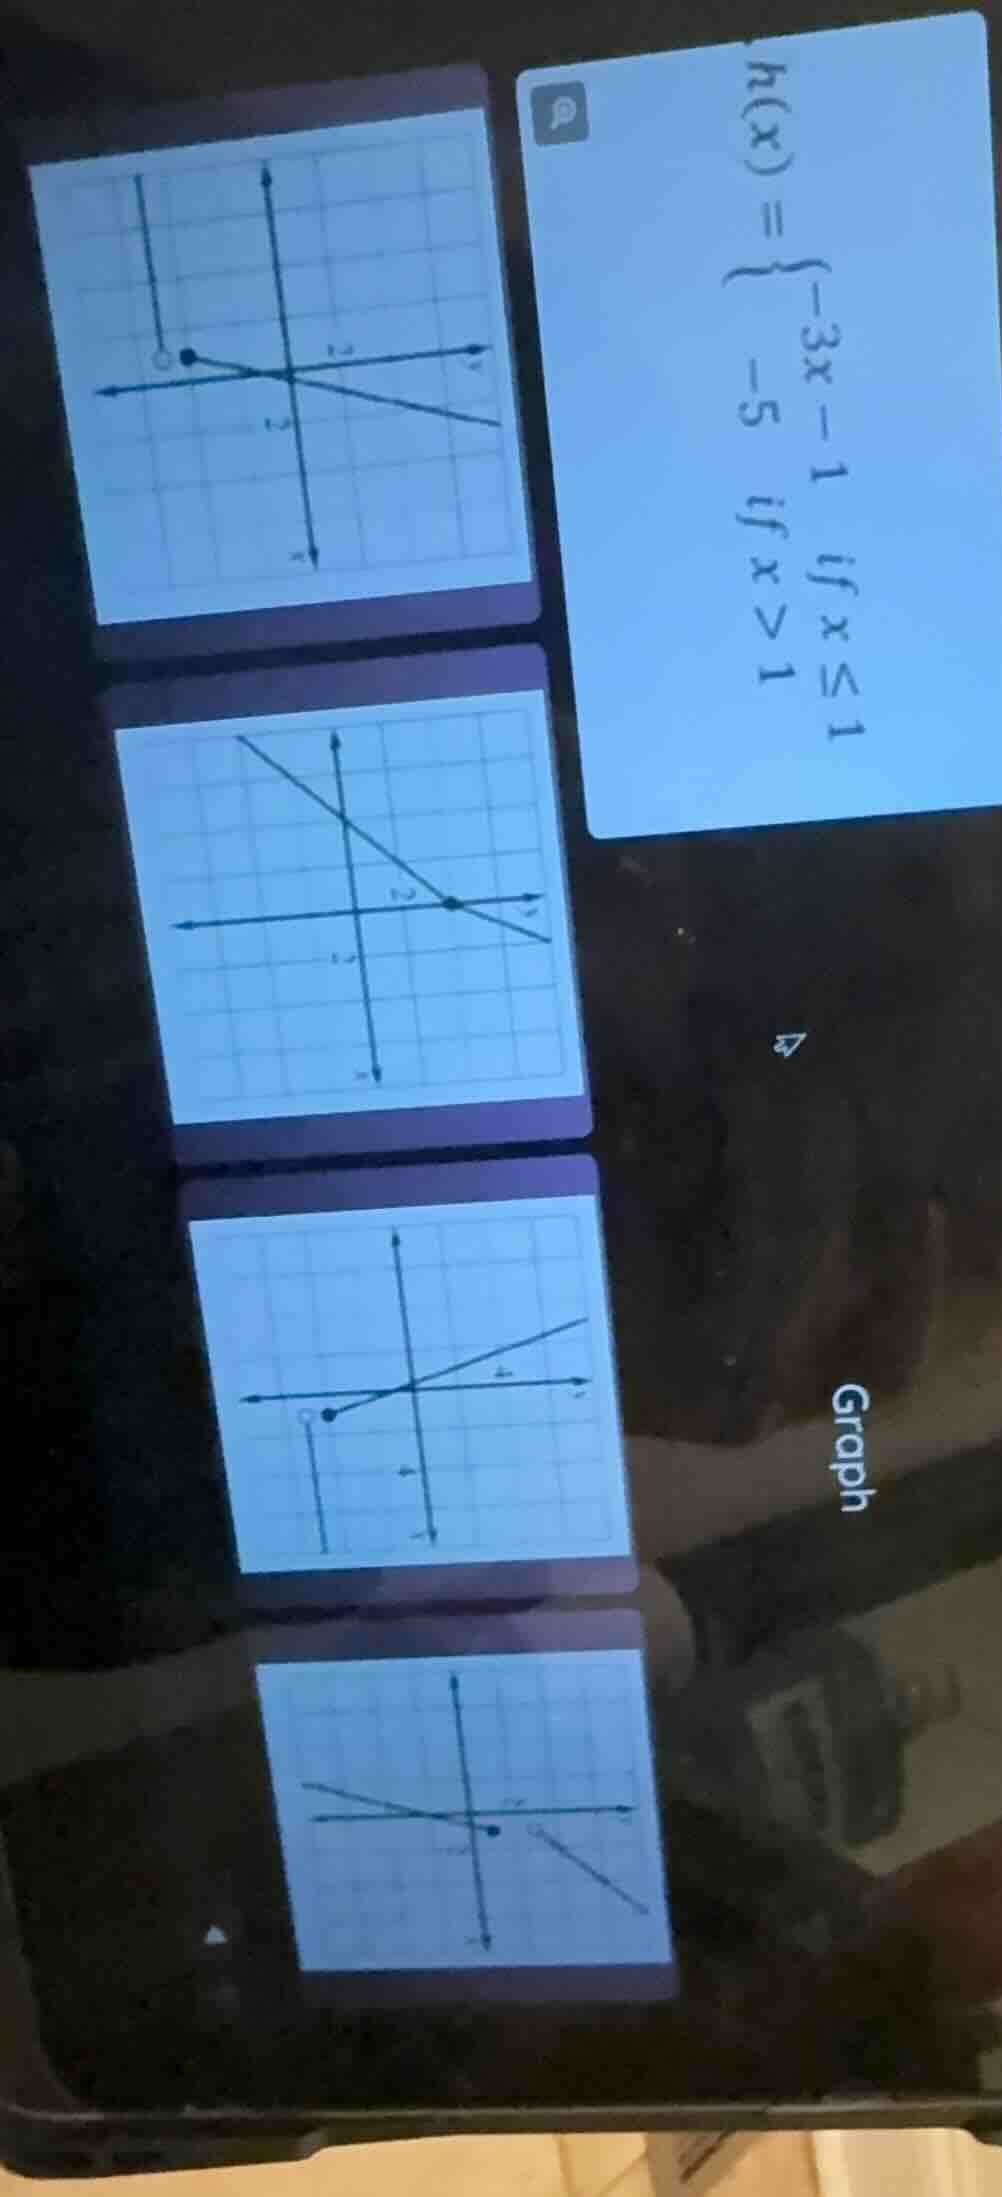
h(x) = \
graph
Step1: Analyze the piecewise function for \( x \leq 1 \)
The function for \( x \leq 1 \) is \( h(x) = -3x - 1 \). This is a linear function with slope \( -3 \) (negative, so decreasing) and y-intercept \( -1 \). Let's find the value at \( x = 1 \): \( h(1) = -3(1) - 1 = -4 \). So at \( x = 1 \), the point is \( (1, -4) \), and since \( x \leq 1 \) includes \( x = 1 \), this should be a closed dot. For \( x < 1 \), we can take another point, say \( x = 0 \): \( h(0) = -3(0) - 1 = -1 \), so the line passes through \( (0, -1) \) and \( (1, -4) \), decreasing.
Step2: Analyze the piecewise function for \( x > 1 \)
The function for \( x > 1 \) is \( h(x) = -5 \), which is a horizontal line (constant function) at \( y = -5 \). Since \( x > 1 \), at \( x = 1 \), this part has an open dot (because \( x = 1 \) is not included here), and for \( x > 1 \), the y-value is always \( -5 \).
Now, let's check the graphs:
- The first graph (top - left) has a closed dot at some point, a line with negative slope, and a horizontal segment at \( y = -5 \) for \( x > 1 \) (open dot at \( x = 1 \) for the horizontal part). Let's verify the \( x \leq 1 \) part: when \( x = 1 \), \( h(1) = -3(1) - 1 = -4 \)? Wait, no, wait: Wait, maybe I miscalculated. Wait, \( h(1) \) for \( x \leq 1 \) is \( -3(1) - 1 = -4 \), but the horizontal part is \( y = -5 \). Wait, maybe the first graph: Let's re - evaluate. Wait, maybe the first graph's closed dot is at \( x = 1 \) for the \( x \leq 1 \) part, and the horizontal line is \( y = -5 \) for \( x > 1 \). Wait, perhaps I made a mistake in the \( x = 1 \) calculation. Wait, no, the function is \( h(x)=
\). So at \( x = 1 \), the \( x \leq 1 \) part gives \( h(1)=-3(1)-1=-4 \), and the \( x > 1 \) part is \( y = -5 \), so at \( x = 1 \), the \( x \leq 1 \) part has a closed dot at \( (1, -4) \), and the \( x > 1 \) part has an open dot at \( (1, -5) \).
Looking at the graphs, the top - left graph: The line with negative slope (decreasing) passes through, say, when \( x = 0 \), \( y=-1 \) (since \( -3(0)-1=-1 \)), and at \( x = 1 \), \( y=-4 \) (closed dot). Then, for \( x > 1 \), it's a horizontal line at \( y = -5 \) (open dot at \( x = 1 \) for this horizontal line). This matches the piecewise function.
The other graphs:
- The second graph (middle - left) is a single line, not piecewise, so it's out.
- The third graph (bottom - left) has a positive slope, which doesn't match the negative slope of \( -3x - 1 \), so it's out.
- The fourth graph (bottom - right) has two lines, but the slopes and intercepts don't match.

Snap & solve any problem in the app
Get step-by-step solutions on Sovi AI
Photo-based solutions with guided steps
Explore more problems and detailed explanations
The top - left graph (the first graph) is the correct graph for \( h(x)=
\)