QUESTION IMAGE
Question
○ a 0.41
○ b 1.34
● c 0.52
○ d .3813
question 8 (1 point)
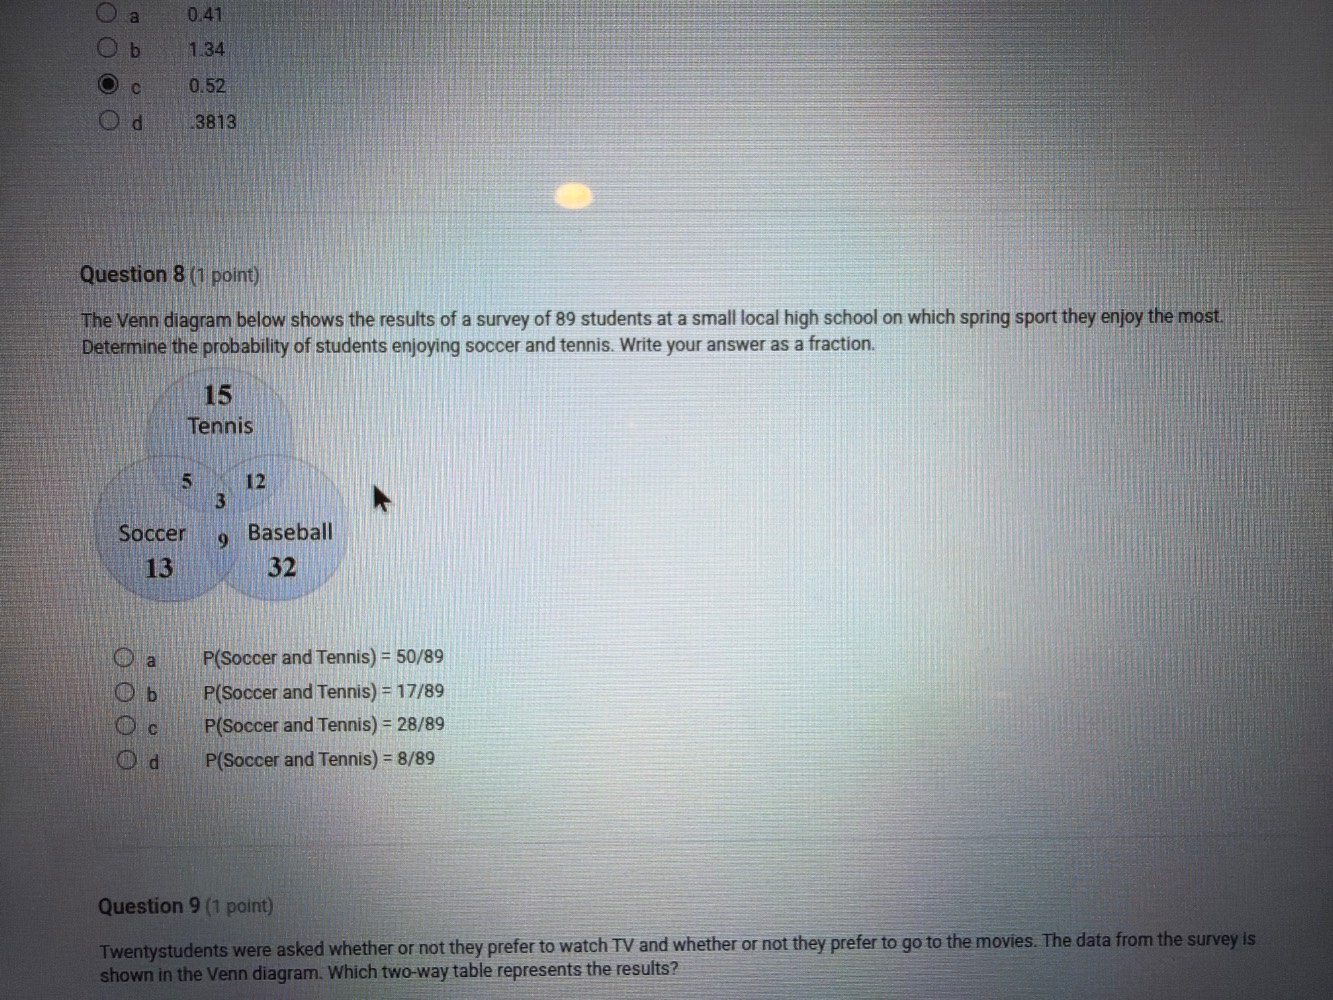
the venn diagram below shows the results of a survey of 89 students at a small local high school on which spring sport they enjoy the most. determine the probability of students enjoying soccer and tennis. write your answer as a fraction.
○ a p(soccer and tennis) = 50/89
○ b p(soccer and tennis) = 17/89
○ c p(soccer and tennis) = 28/89
○ d p(soccer and tennis) = 8/89
question 9 (1 point)
twenty students were asked whether or not they prefer to watch tv and whether or not they prefer to go to the movies. the data from the survey is shown in the venn diagram. which two-way table represents the results?
Step1: Identify overlap of Soccer & Tennis
In the Venn diagram, the region where Soccer and Tennis circles overlap has the value 5. This is the number of students who enjoy both sports.
Step2: Set up probability formula
Probability is the number of favorable outcomes divided by total outcomes. Total students = 89.
$$P(\text{Soccer and Tennis}) = \frac{\text{Number of students who like both}}{\text{Total number of students}}$$
Step3: Substitute values into formula
$$P(\text{Soccer and Tennis}) = \frac{5 + 3}{89} = \frac{8}{89}$$
(Note: The overlap region for Soccer and Tennis includes the 5 that is only Soccer-Tennis overlap, and the 3 that is all three sports, as those students also enjoy both Soccer and Tennis)

Snap & solve any problem in the app
Get step-by-step solutions on Sovi AI
Photo-based solutions with guided steps
Explore more problems and detailed explanations
d. P(Soccer and Tennis) = 8/89