QUESTION IMAGE
Question
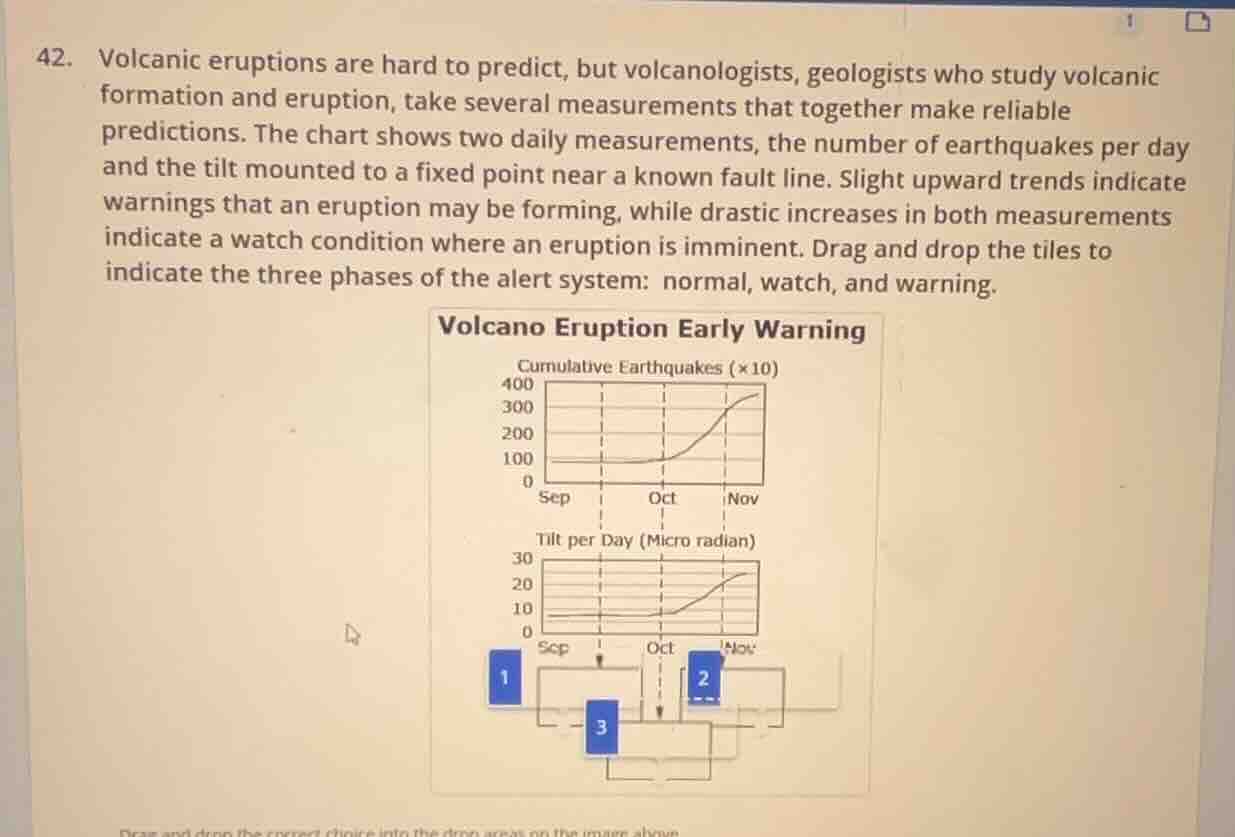
- volcanic eruptions are hard to predict, but volcanologists, geologists who study volcanic formation and eruption, take several measurements that together make reliable predictions. the chart shows two daily measurements, the number of earthquakes per day and the tilt mounted to a fixed point near a known fault line. slight upward trends indicate warnings that an eruption may be forming, while drastic increases in both measurements indicate a watch condition where an eruption is imminent. drag and drop the tiles to indicate the three phases of the alert system: normal, watch, and warning.
Brief Explanations
- Normal Phase: In the normal phase, both the number of earthquakes (cumulative) and the tilt per day should show relatively stable, low - level values with no upward trend. Looking at the time periods, before the noticeable changes (before around October), the measurements are stable. So the time period with stable, low earthquake counts and tilt values corresponds to the normal phase. Tile 1 (assuming the left - most, earliest time period) is for normal as it has stable, low measurements.
- Warning Phase: The warning phase is characterized by a slight upward trend in both measurements. After the initial stable period (around the time leading up to the more drastic increase), there is a slight upward trend in both the cumulative earthquakes and the tilt per day. Tile 3 (the middle - time period with a slight upward trend) corresponds to the warning phase as it shows the slight upward trend indicating a potential eruption is forming.
- Watch Phase: The watch phase is when there are drastic increases in both measurements. The later time period (around November) shows a drastic increase in both cumulative earthquakes and tilt per day, indicating an imminent eruption. Tile 2 (the right - most, later time period with drastic increases) corresponds to the watch phase.

Snap & solve any problem in the app
Get step-by-step solutions on Sovi AI
Photo-based solutions with guided steps
Explore more problems and detailed explanations
- Normal
- Watch
- Warning
(Note: The assignment is based on the description of the phases: normal (stable, low), warning (slight upward trend), watch (drastic increase) and matching to the time - based trends in the graphs for cumulative earthquakes and tilt per day.)