QUESTION IMAGE
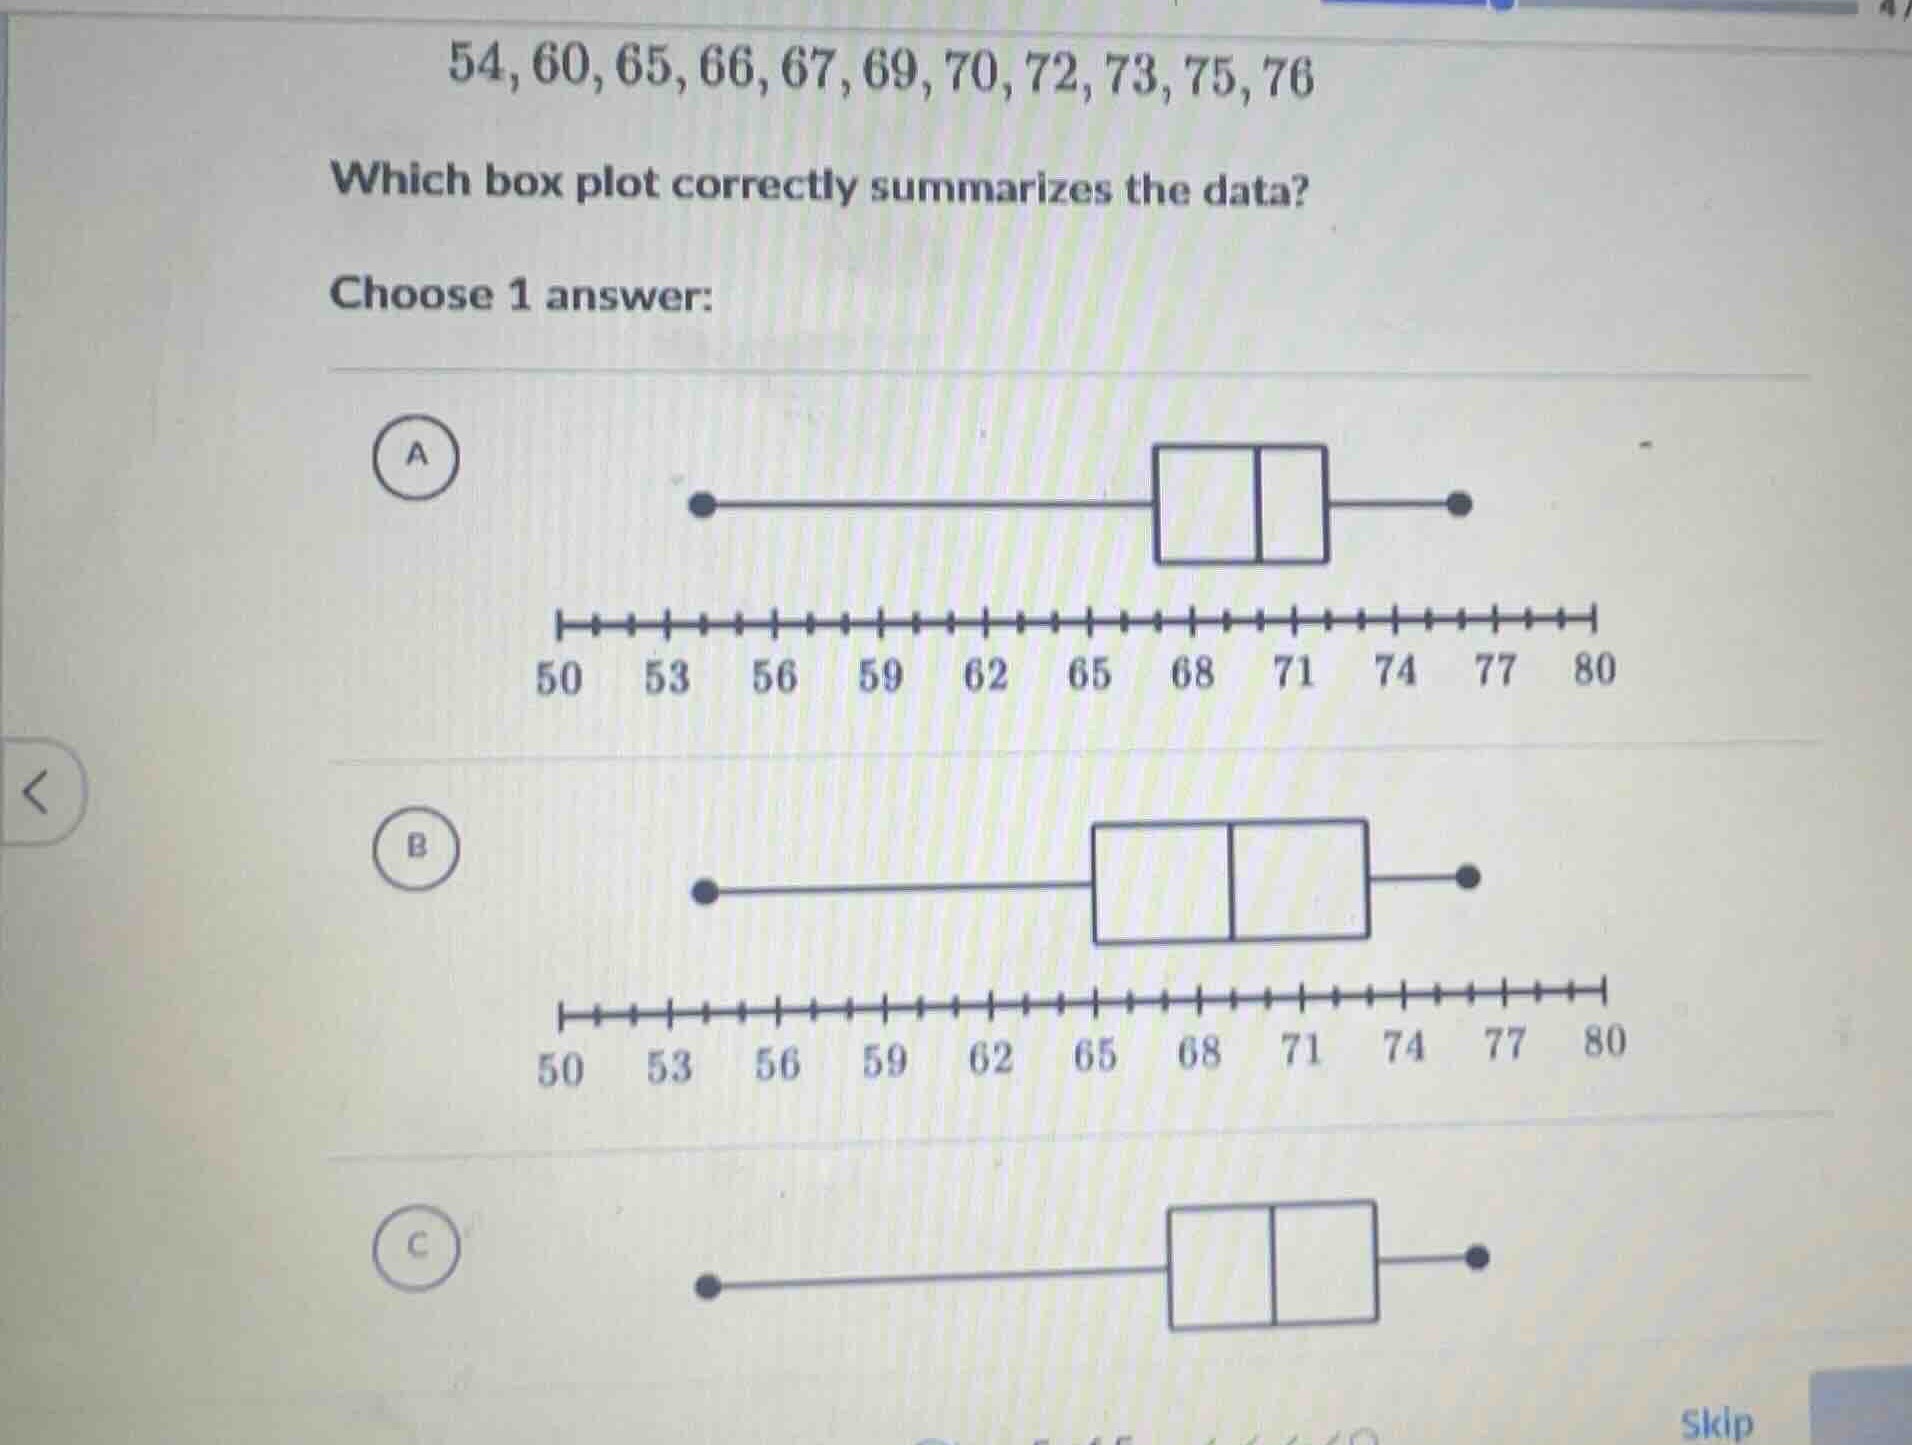
Question
54, 60, 65, 66, 67, 69, 70, 72, 73, 75, 76
which box plot correctly summarizes the data?
choose 1 answer:
a
box plot a
50 53 56 59 62 65 68 71 74 77 80
b
box plot b
50 53 56 59 62 65 68 71 74 77 80
c
box plot c
Step1: Find the minimum, Q1, median, Q3, maximum
The data set is \( 54, 60, 65, 66, 67, 69, 70, 72, 73, 75, 76 \) (11 values).
- Minimum: \( 54 \)
- Q1 (25th percentile): The median of the first 5 values (\( 54, 60, 65, 66, 67 \)) is \( 65 \).
- Median (50th percentile): The 6th value, \( 69 \).
- Q3 (75th percentile): The median of the last 5 values (\( 70, 72, 73, 75, 76 \)) is \( 73 \).
- Maximum: \( 76 \).
Step2: Analyze the box plots
- The box spans Q1 (\( 65 \)) to Q3 (\( 73 \)), with the median (\( 69 \)) inside.
- The whiskers extend from min (\( 54 \)) to max (\( 76 \)).
Now, check the options:
- Option A: The left whisker starts at \( 54 \), Q1 around \( 68 \)? No, Q1 should be \( 65 \). Wait, re - evaluate. Wait, the x - axis ticks: Let's check the positions. The first plot (A) has the box starting around 68? No, our Q1 is 65. Wait, maybe the x - axis is marked with intervals. Wait, the x - axis has ticks from 50 to 80. Let's count the ticks. From 50 to 53 is 3 units? Wait, no, each small tick is 1? Wait, 50, 53, 56... no, maybe each major tick is 3? No, that can't be. Wait, maybe the x - axis is in increments of 1. Wait, 50, 51, 52, 53... So 54 is at 54, 60 at 60, 65 at 65, 69 at 69, 73 at 73, 76 at 76.
Looking at option A: The left whisker is at 54, the box starts at Q1 (65), median at 69, Q3 at 73, right whisker at 76. Wait, maybe my initial Q1 calculation was wrong? Wait, no, for 11 data points, the positions are:
- Position of Q1: \( \frac{11 + 1}{4}=3 \)rd value? Wait, no, the formula for percentile position is \( i=\frac{p}{100}(n + 1) \). For Q1 (25th percentile), \( i = 0.25\times(11 + 1)=3 \), so the 3rd value is \( 65 \). For Q3 (75th percentile), \( i = 0.75\times(11 + 1)=9 \), the 9th value is \( 73 \). Median is the 6th value (\( 69 \)).
Now, looking at the box plots:
- Option A: The left whisker is at 54, the box starts at around 65 (Q1), median at 69, Q3 at around 73, right whisker at 76.
- Option B: Q1 seems lower? No, our Q1 is 65. Wait, maybe I made a mistake. Wait, let's re - calculate Q1 and Q3. Wait, for a data set with \( n = 11 \) (odd), the first half is the first 5 numbers (\( 54,60,65,66,67 \)), median of first half is the 3rd number, which is 65. The second half is the last 5 numbers (\( 70,72,73,75,76 \)), median of second half is the 3rd number (73). Median is the 6th number (69).
Now, looking at the box plots:
- The box in a box plot should have Q1 at the left edge, Q3 at the right edge, and median inside. The whiskers go from min to Q1 and Q3 to max.
Option A: The left whisker is at 54 (min), the left edge of the box is at Q1 (65), median at 69, right edge of the box at Q3 (73), right whisker at 76 (max). This matches our calculations.
Option B: The left edge of the box is at a value higher than 65? No, our Q1 is 65. So option A is correct.

Snap & solve any problem in the app
Get step-by-step solutions on Sovi AI
Photo-based solutions with guided steps
Explore more problems and detailed explanations
A