QUESTION IMAGE
Question
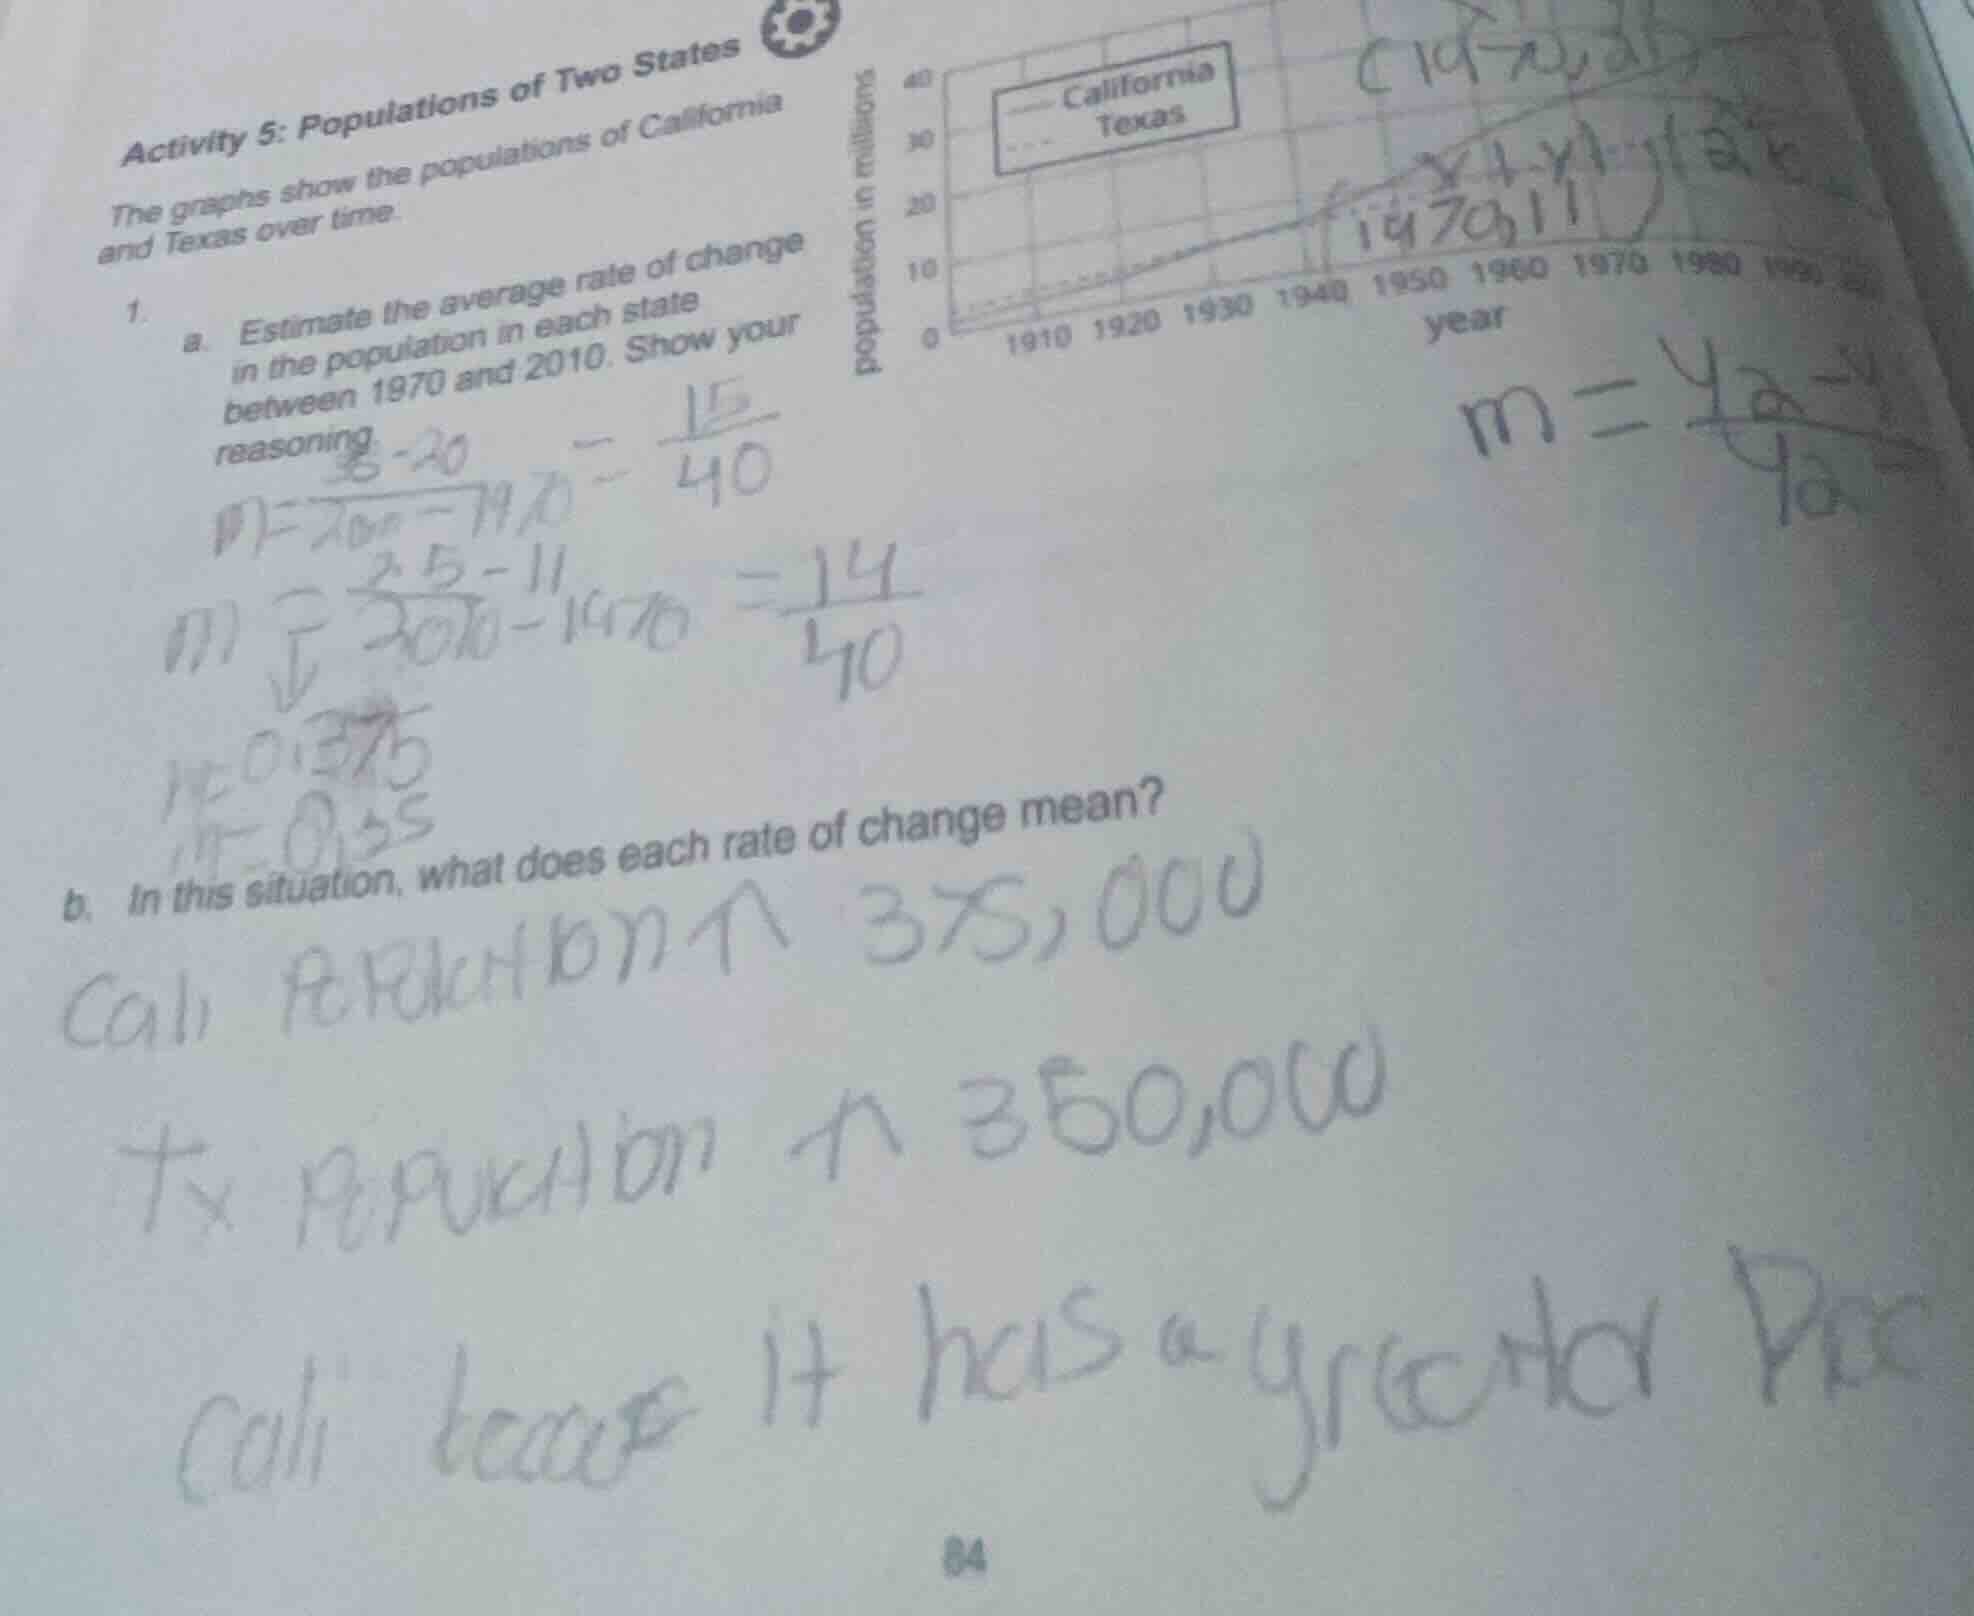
activity 5: populations of two statesthe graphs show the populations of californiaand texas over time.1.a. estimate the average rate of changein the population in each statebetween 1970 and 2010. show yourreasoning.b. in this situation, what does each rate of change mean?
Step1: Identify 1970/2010 populations (CA)
From the graph: 1970 CA pop = 20 million, 2010 CA pop = 35 million
Step2: Calculate CA rate of change
$\text{Rate}_\text{CA} = \frac{35 - 20}{2010 - 1970} = \frac{15}{40} = 0.375$ million/year
Step3: Identify 1970/2010 populations (TX)
From the graph: 1970 TX pop = 11 million, 2010 TX pop = 25 million
Step4: Calculate TX rate of change
$\text{Rate}_\text{TX} = \frac{25 - 11}{2010 - 1970} = \frac{14}{40} = 0.35$ million/year
Step5: Interpret the rates
Convert to whole numbers and explain context: 0.375 million = 375,000; 0.35 million = 350,000. These represent annual average population growth.

Snap & solve any problem in the app
Get step-by-step solutions on Sovi AI
Photo-based solutions with guided steps
Explore more problems and detailed explanations
a. California: $\frac{35 - 20}{2010 - 1970} = 0.375$ million people per year
Texas: $\frac{25 - 11}{2010 - 1970} = 0.35$ million people per year
b. The rate for California means its population increased by an average of 375,000 people per year between 1970 and 2010. The rate for Texas means its population increased by an average of 350,000 people per year over the same period. California had a faster average annual population growth rate than Texas.