QUESTION IMAGE
Question
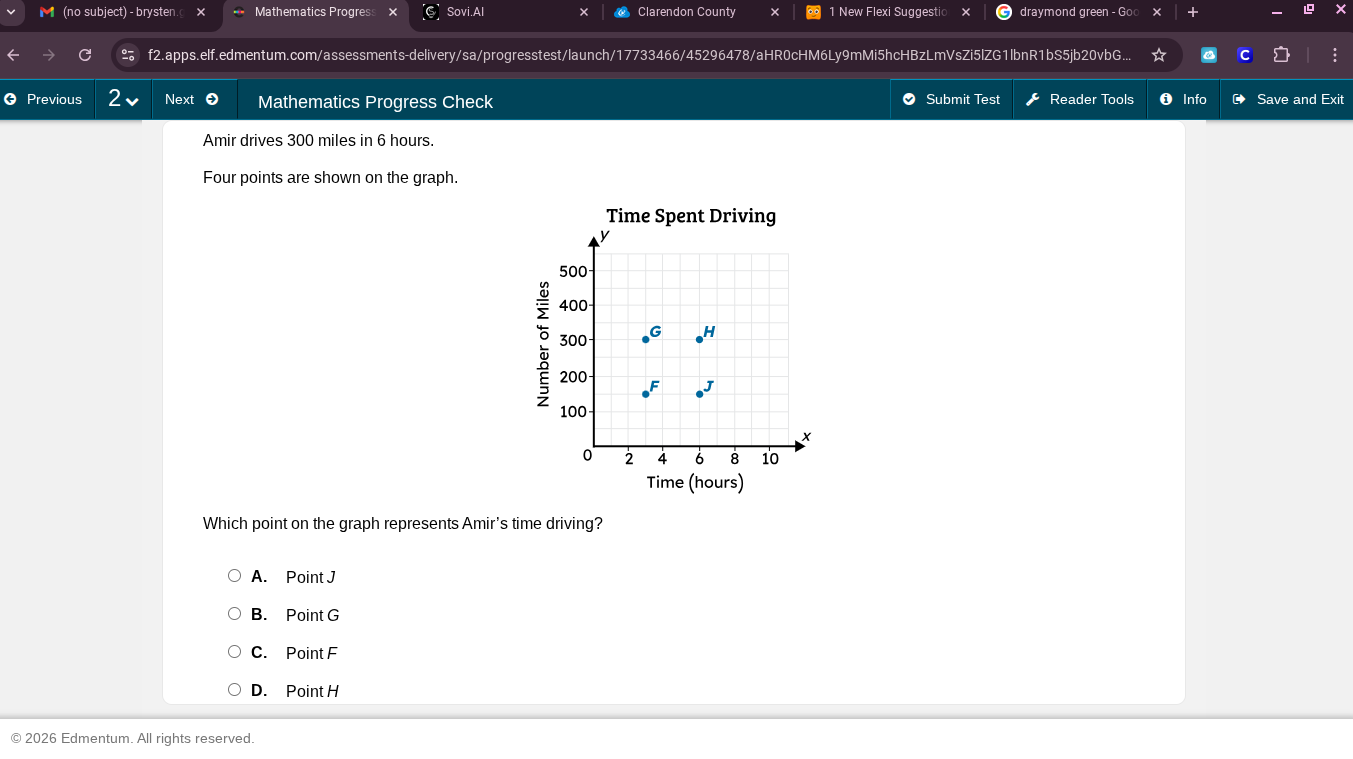
amir drives 300 miles in 6 hours.
four points are shown on the graph.
graph: time spent driving, x-axis: time (hours) from 0 to 10, y-axis: number of miles from 0 to 500. points: f (3, 150), g (3, 300), h (5, 300), j (5, 150)
which point on the graph represents amir’s time driving?
a. point j
b. point g
c. point f
d. point h
Step1: Determine Amir's rate
Amir drives 300 miles in 6 hours. So the relationship is miles (y - axis) vs time (x - axis). We can find the coordinates: x = 6 (hours), y = 300 (miles).
Step2: Analyze the points
- Point F: Let's assume its coordinates. From the graph, F seems to be at x = 4, y = 150 (approx).
- Point G: At x = 4, y = 300.
- Point H: At x = 6, y = 300? Wait, no, wait. Wait, Amir's time is 6 hours, distance 300 miles. So x (time) should be 6, y (distance) 300? Wait, no, wait the graph: x is time (hours), y is number of miles. So Amir's data point is (6, 300)? Wait no, 300 miles in 6 hours. So when x = 6, y = 300? Wait, let's check the points:
Looking at the graph:
- Point F: x = 4, y = 150 (maybe)
- Point G: x = 4, y = 300
- Point H: x = 6, y = 300? Wait, no, the x - axis is time (hours), so Amir drives 6 hours, so x = 6. And distance is 300 miles, so y = 300. So we need the point with x = 6 and y = 300? Wait, no, wait the options:
Wait the options are A. Point J, B. Point G, C. Point F, D. Point H.
Wait let's re - evaluate. Amir's rate: 300 miles / 6 hours = 50 miles per hour. So for time t (x), distance d (y) = 50t.
So when t = 6, d = 50*6 = 300. So the point should have x = 6, y = 300.
Now looking at the graph:
- Point H: Let's see, x = 6, y = 300? Wait, the points: G is at x = 4, y = 300; H is at x = 6, y = 300? Wait no, maybe I misread. Wait the x - axis: the grid lines. Let's count the x - axis: from 0 to 10, with ticks at 2,4,6,8,10. Y - axis: 0,100,200,300,400,500.
So:
- Point F: x = 4, y = 150 (since it's halfway between 100 and 200 at x = 4)
- Point G: x = 4, y = 300
- Point H: x = 6, y = 300? Wait, no, maybe I made a mistake. Wait, no, Amir's time is 6 hours, so x = 6. And distance 300 miles, so y = 300. So which point is at (6, 300)? Wait, looking at the graph, Point H: x = 6, y = 300? Wait, no, the blue dots:
Wait the graph has four points: F, G, H, J.
- F: x = 4, y = 150 (approx)
- G: x = 4, y = 300
- H: x = 6, y = 300? Wait, no, maybe H is at x = 6, y = 300? Wait, no, let's check the problem again. Amir drives 300 miles in 6 hours. So the point should be (6, 300). So we need to find the point with x = 6 and y = 300.
Looking at the options:
- Point H: Let's assume that at x = 6 (time = 6 hours), y = 300 (miles). So Point H is at (6, 300), which matches Amir's data (6 hours, 300 miles).
Wait, maybe I was confused earlier. Let's check the x - coordinate: Amir's time is 6 hours, so x = 6. The y - coordinate is 300 miles. So we look for the point with x = 6 and y = 300. Among the points, Point H is at x = 6 (since x - axis: 0,2,4,6,8,10; so 6 is the x - value for H) and y = 300 (since y - axis: 0,100,200,300,400,500; H is at y = 300). So Point H is (6, 300), which is Amir's time - distance point.
Wait, but let's check the other points:
- Point G: x = 4, y = 300 (time 4 hours, distance 300 miles: rate 75 mph, not Amir's)
- Point F: x = 4, y = 150 (rate 37.5 mph)
- Point J: x = 6, y = 150 (rate 25 mph)
- Point H: x = 6, y = 300 (rate 50 mph, which is 300/6 = 50)
Yes, so Point H has x = 6 (time) and y = 300 (distance), which matches Amir's 300 miles in 6 hours.

Snap & solve any problem in the app
Get step-by-step solutions on Sovi AI
Photo-based solutions with guided steps
Explore more problems and detailed explanations
D. Point H