QUESTION IMAGE
Question
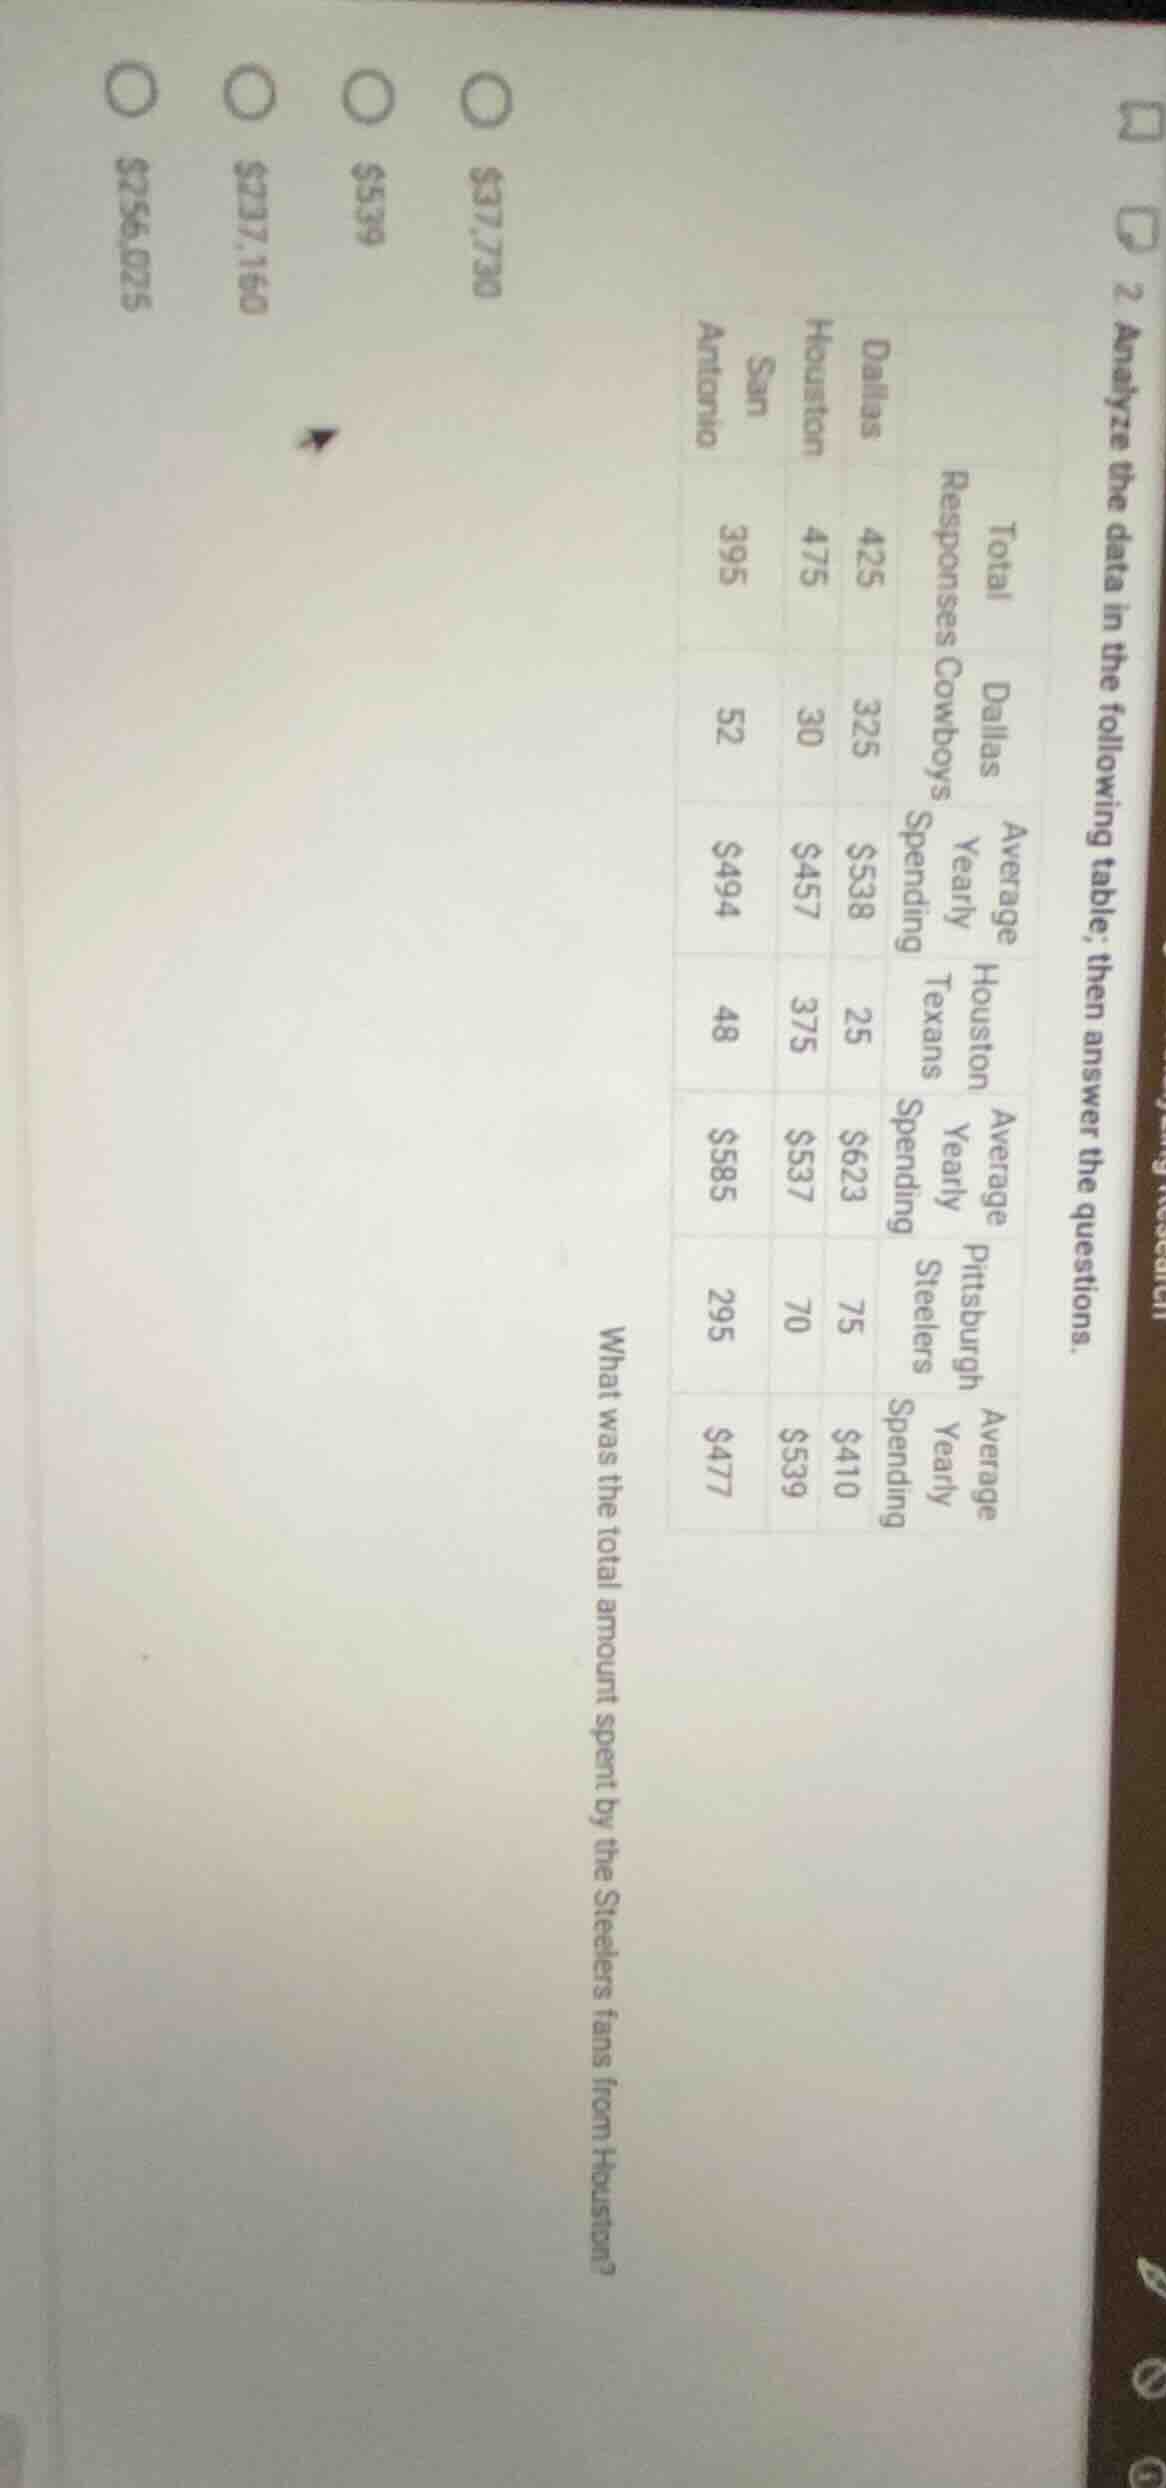
- analyze the data in the following table; then answer the questions.| | dallas | houston | san antonio || ---- | ---- | ---- | ---- || total responses | 425 | 475 | 395 || dallas cowboys average yearly spending | 325 | 30 | 52 || houston texans average yearly spending | $538 | $457 | $494 || pittsburgh steelers average yearly spending | 25 | 375 | 48 || pittsburgh steelers average yearly spending | $623 | $537 | $585 || pittsburgh steelers average yearly spending | 75 | 70 | 295 || pittsburgh steelers average yearly spending | $410 | $539 | $477 |what was the total amount spent by the steelers fans from houston?○ $37,730○ $539○ $237,160○ $256,025
Step1: Identify relevant values
From the table, for Houston Steelers fans: number of respondents = 75, average yearly spending = $\$539$.
Step2: Calculate total spending
Total spending = number of respondents × average spending
$\text{Total} = 75 \times 539$
$\text{Total} = 40425$
Wait, correction: Recheck table: Houston Steelers row: 70 respondents, average $\$539$.
Step2 (corrected): Compute total spending
$\text{Total} = 70 \times 539$
$\text{Total} = 37730$

Snap & solve any problem in the app
Get step-by-step solutions on Sovi AI
Photo-based solutions with guided steps
Explore more problems and detailed explanations
$\$37,730$