QUESTION IMAGE
Question
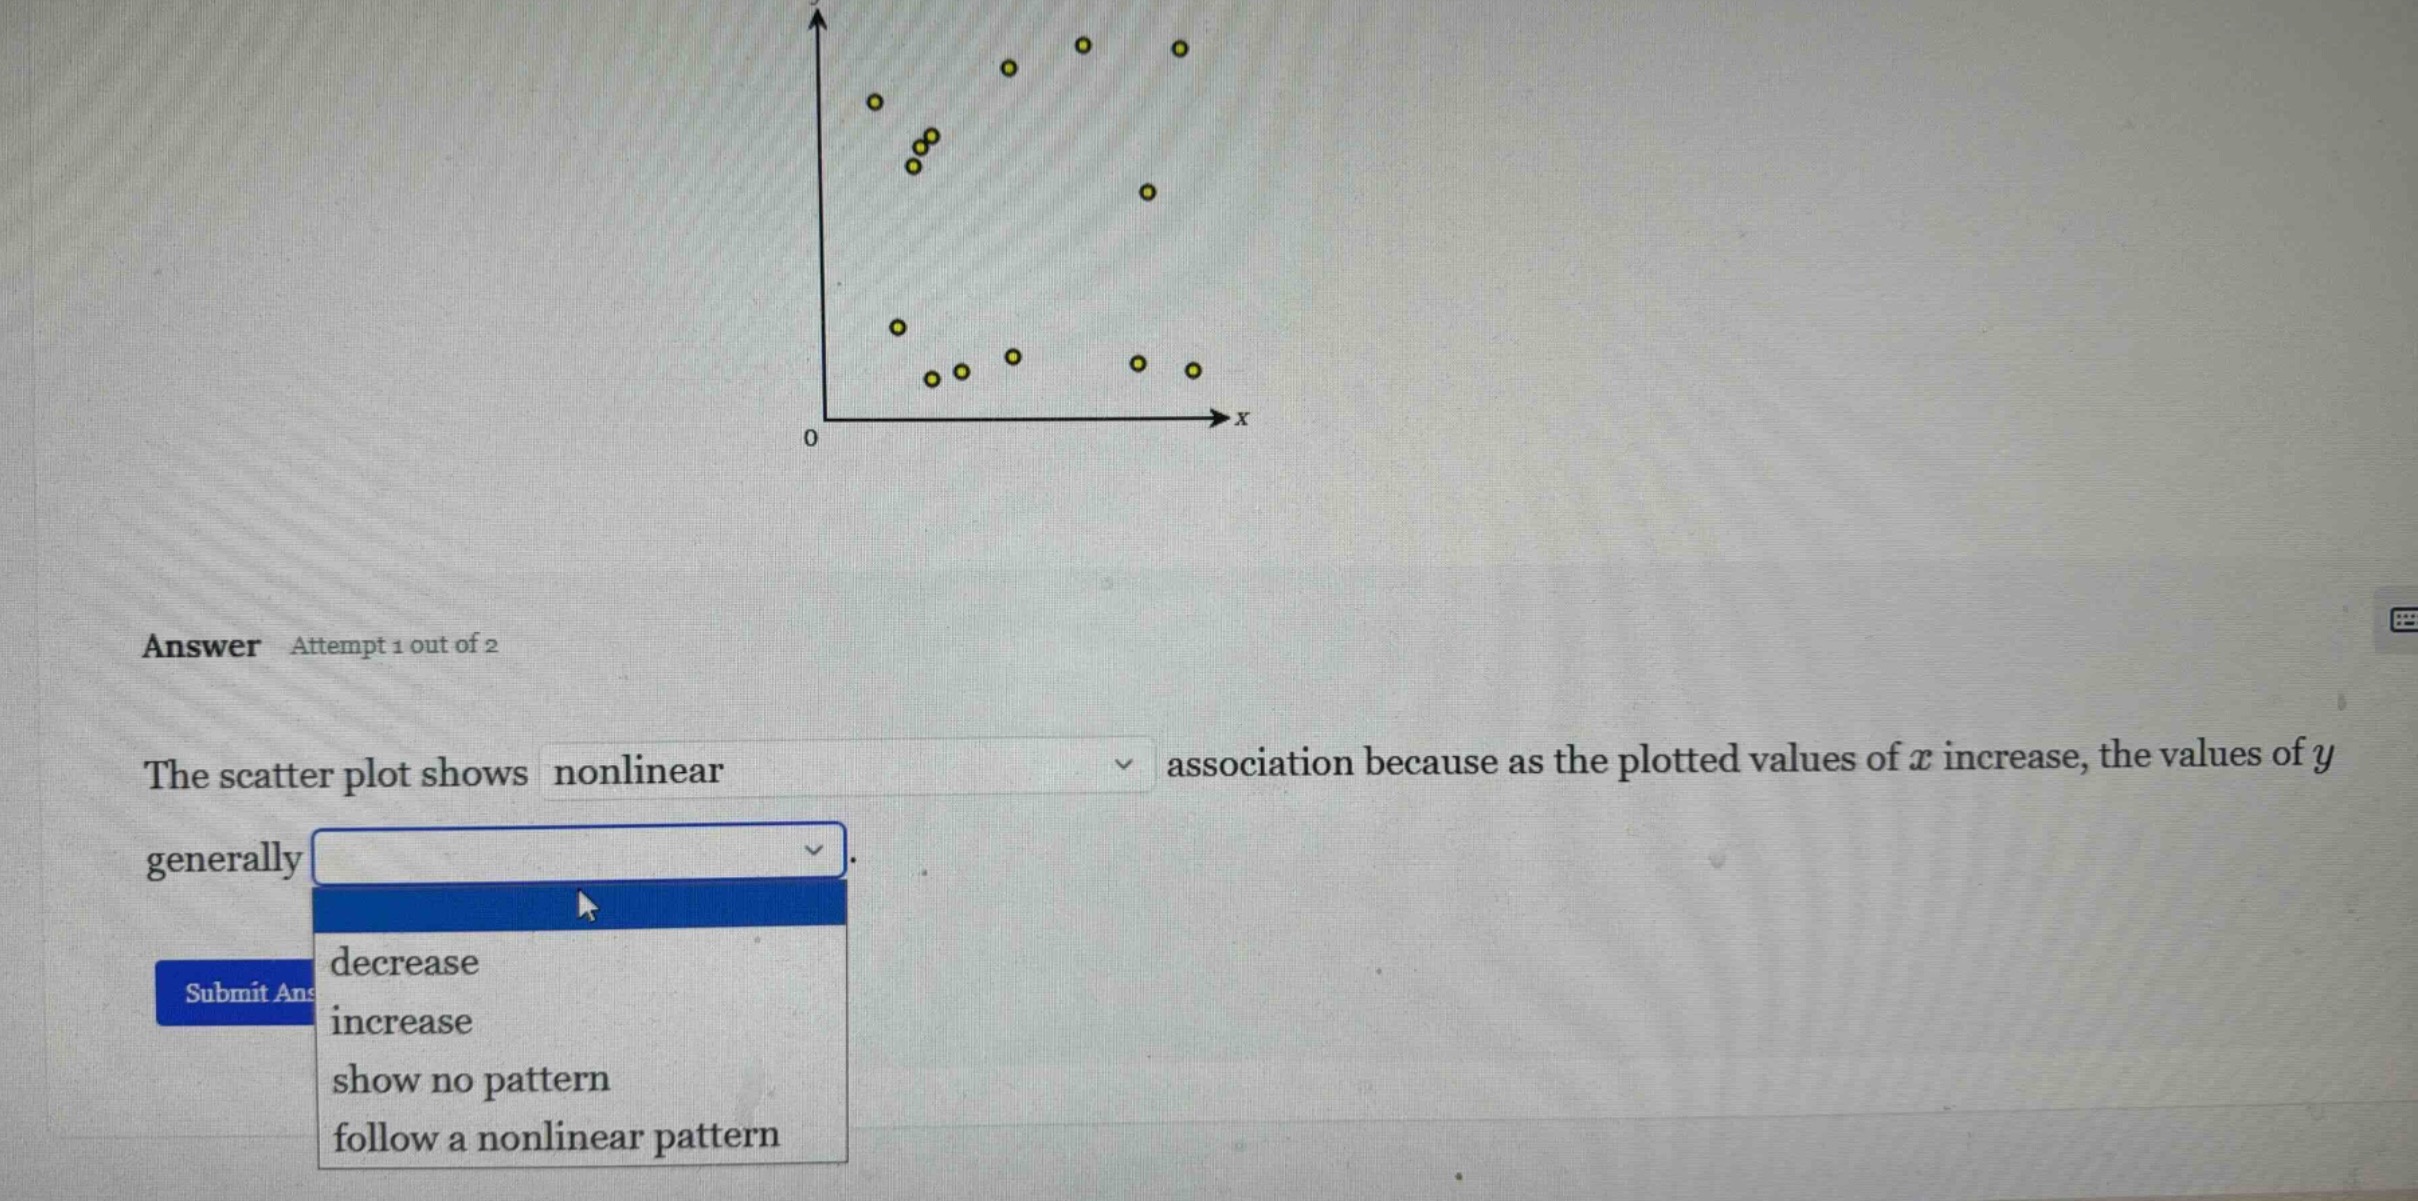
answer attempt 1 out of 2 the scatter plot shows nonlinear association because as the plotted values of x increase, the values of y generally . decrease increase show no pattern follow a nonlinear pattern
The scatter plot has two distinct groups of points: one group where $y$ rises then levels off as $x$ increases, and another lower group where $y$ stays low with $x$ increases. This forms a curved, non-straight (nonlinear) pattern rather than a consistent increase, decrease, or random distribution.

Snap & solve any problem in the app
Get step-by-step solutions on Sovi AI
Photo-based solutions with guided steps
Explore more problems and detailed explanations
The scatter plot shows nonlinear association because as the plotted values of $x$ increase, the values of $y$ generally follow a nonlinear pattern.