QUESTION IMAGE
Question
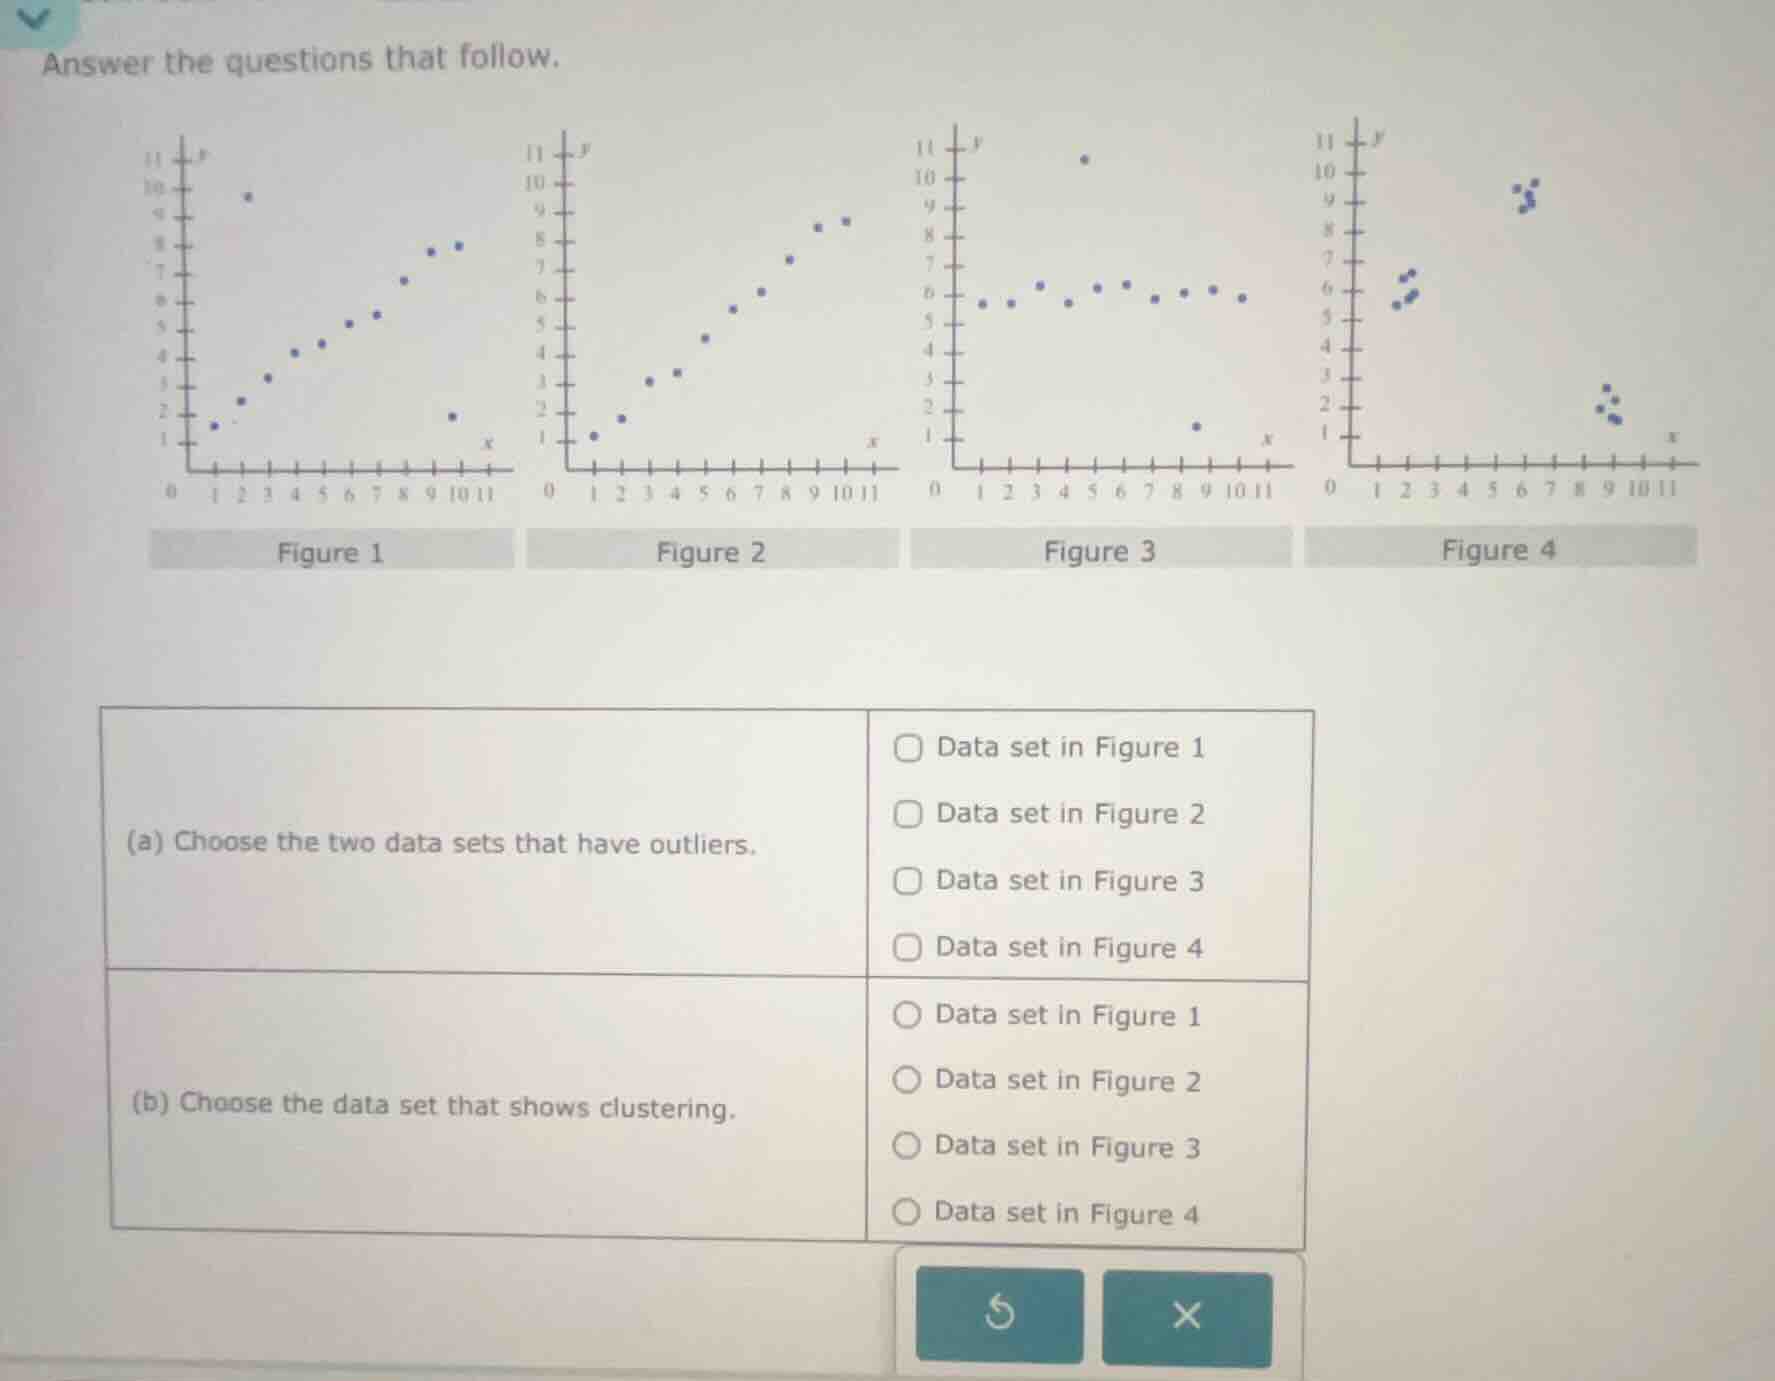
answer the questions that follow.
(a) choose the two data sets that have outliers.
□ data set in figure 1
□ data set in figure 2
□ data set in figure 3
□ data set in figure 4
(b) choose the data set that shows clustering.
○ data set in figure 1
○ data set in figure 2
○ data set in figure 3
○ data set in figure 4
(a) Outliers are data points far from the main group. Figure 1 has two points distant from the upward trend, and Figure 3 has one point far above the clustered middle points.
(b) Clustering is when data forms distinct groups. Figure 4 has three separate groups of points with gaps between them.

Snap & solve any problem in the app
Get step-by-step solutions on Sovi AI
Photo-based solutions with guided steps
Explore more problems and detailed explanations
(a) Data set in Figure 1, Data set in Figure 3
(b) Data set in Figure 4