QUESTION IMAGE
Question
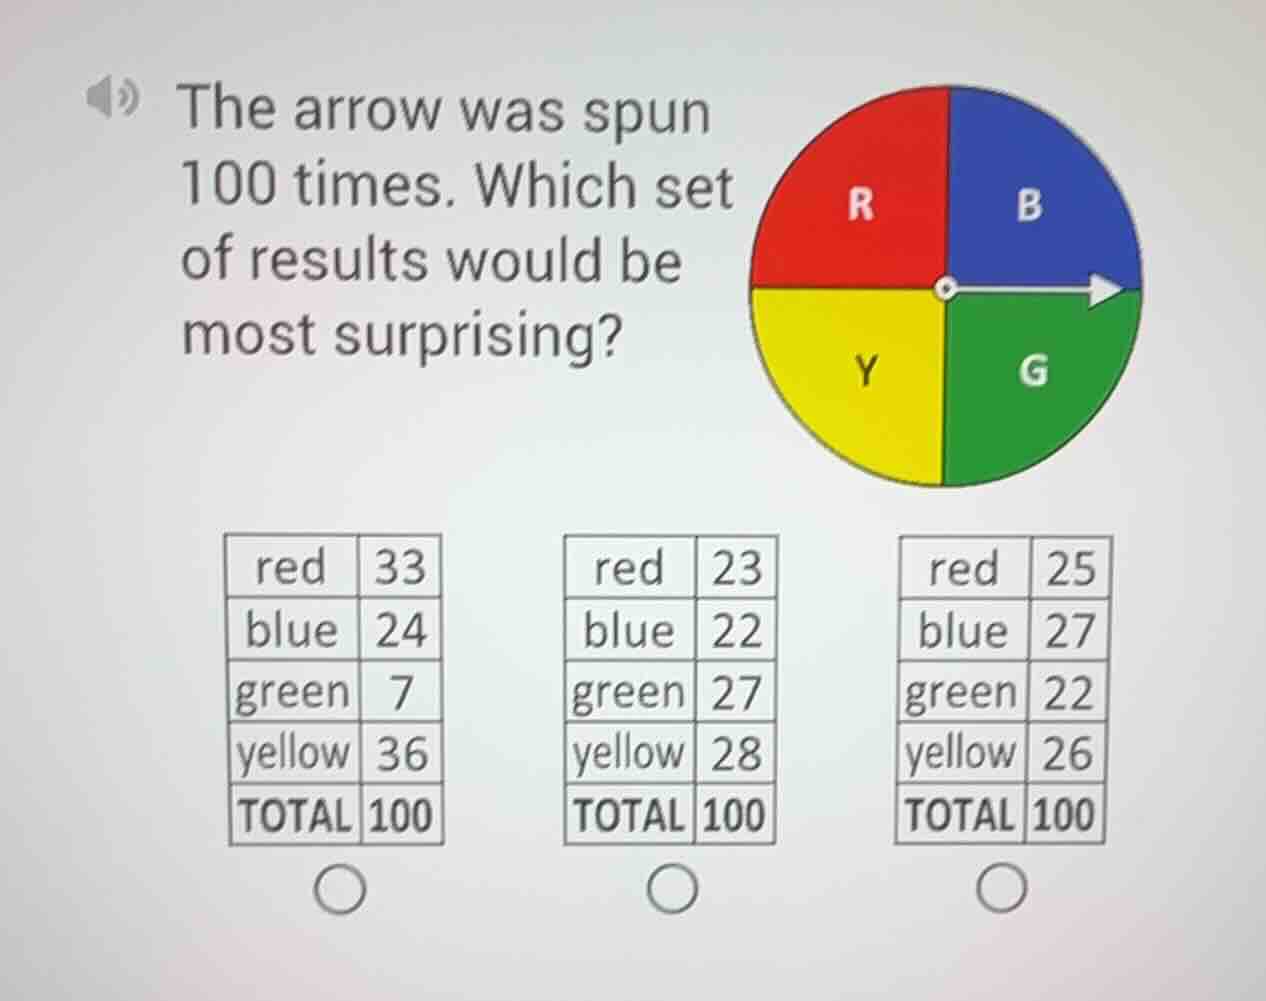
the arrow was spun 100 times. which set of results would be most surprising?
chart: a pie chart divided into four equal parts: red (r), blue (b), yellow (y), green (g). below the chart, three tables with results for red, blue, green, yellow, and total 100. first table: red 33, blue 24, green 7, yellow 36. second table: red 23, blue 22, green 27, yellow 28. third table: red 25, blue 27, green 22, yellow 26. each table has a circle below for selection.
Step1: Find expected frequency
Since the spinner has 4 equal sections, each color has an expected frequency of $\frac{100}{4}=25$ spins.
Step2: Compare to observed results
The first set has green at 7, which is $25-7=18$ less than the expected value. This is a far larger deviation than the differences in the other two sets (where all values are close to 25).
Step3: Identify most surprising result
The greater the deviation from the expected equal frequency, the more surprising the result. The first set has the largest deviation, so it is the most surprising.

Snap & solve any problem in the app
Get step-by-step solutions on Sovi AI
Photo-based solutions with guided steps
Explore more problems and detailed explanations
First set: red 33, blue 24, green 7, yellow 36