QUESTION IMAGE
Question
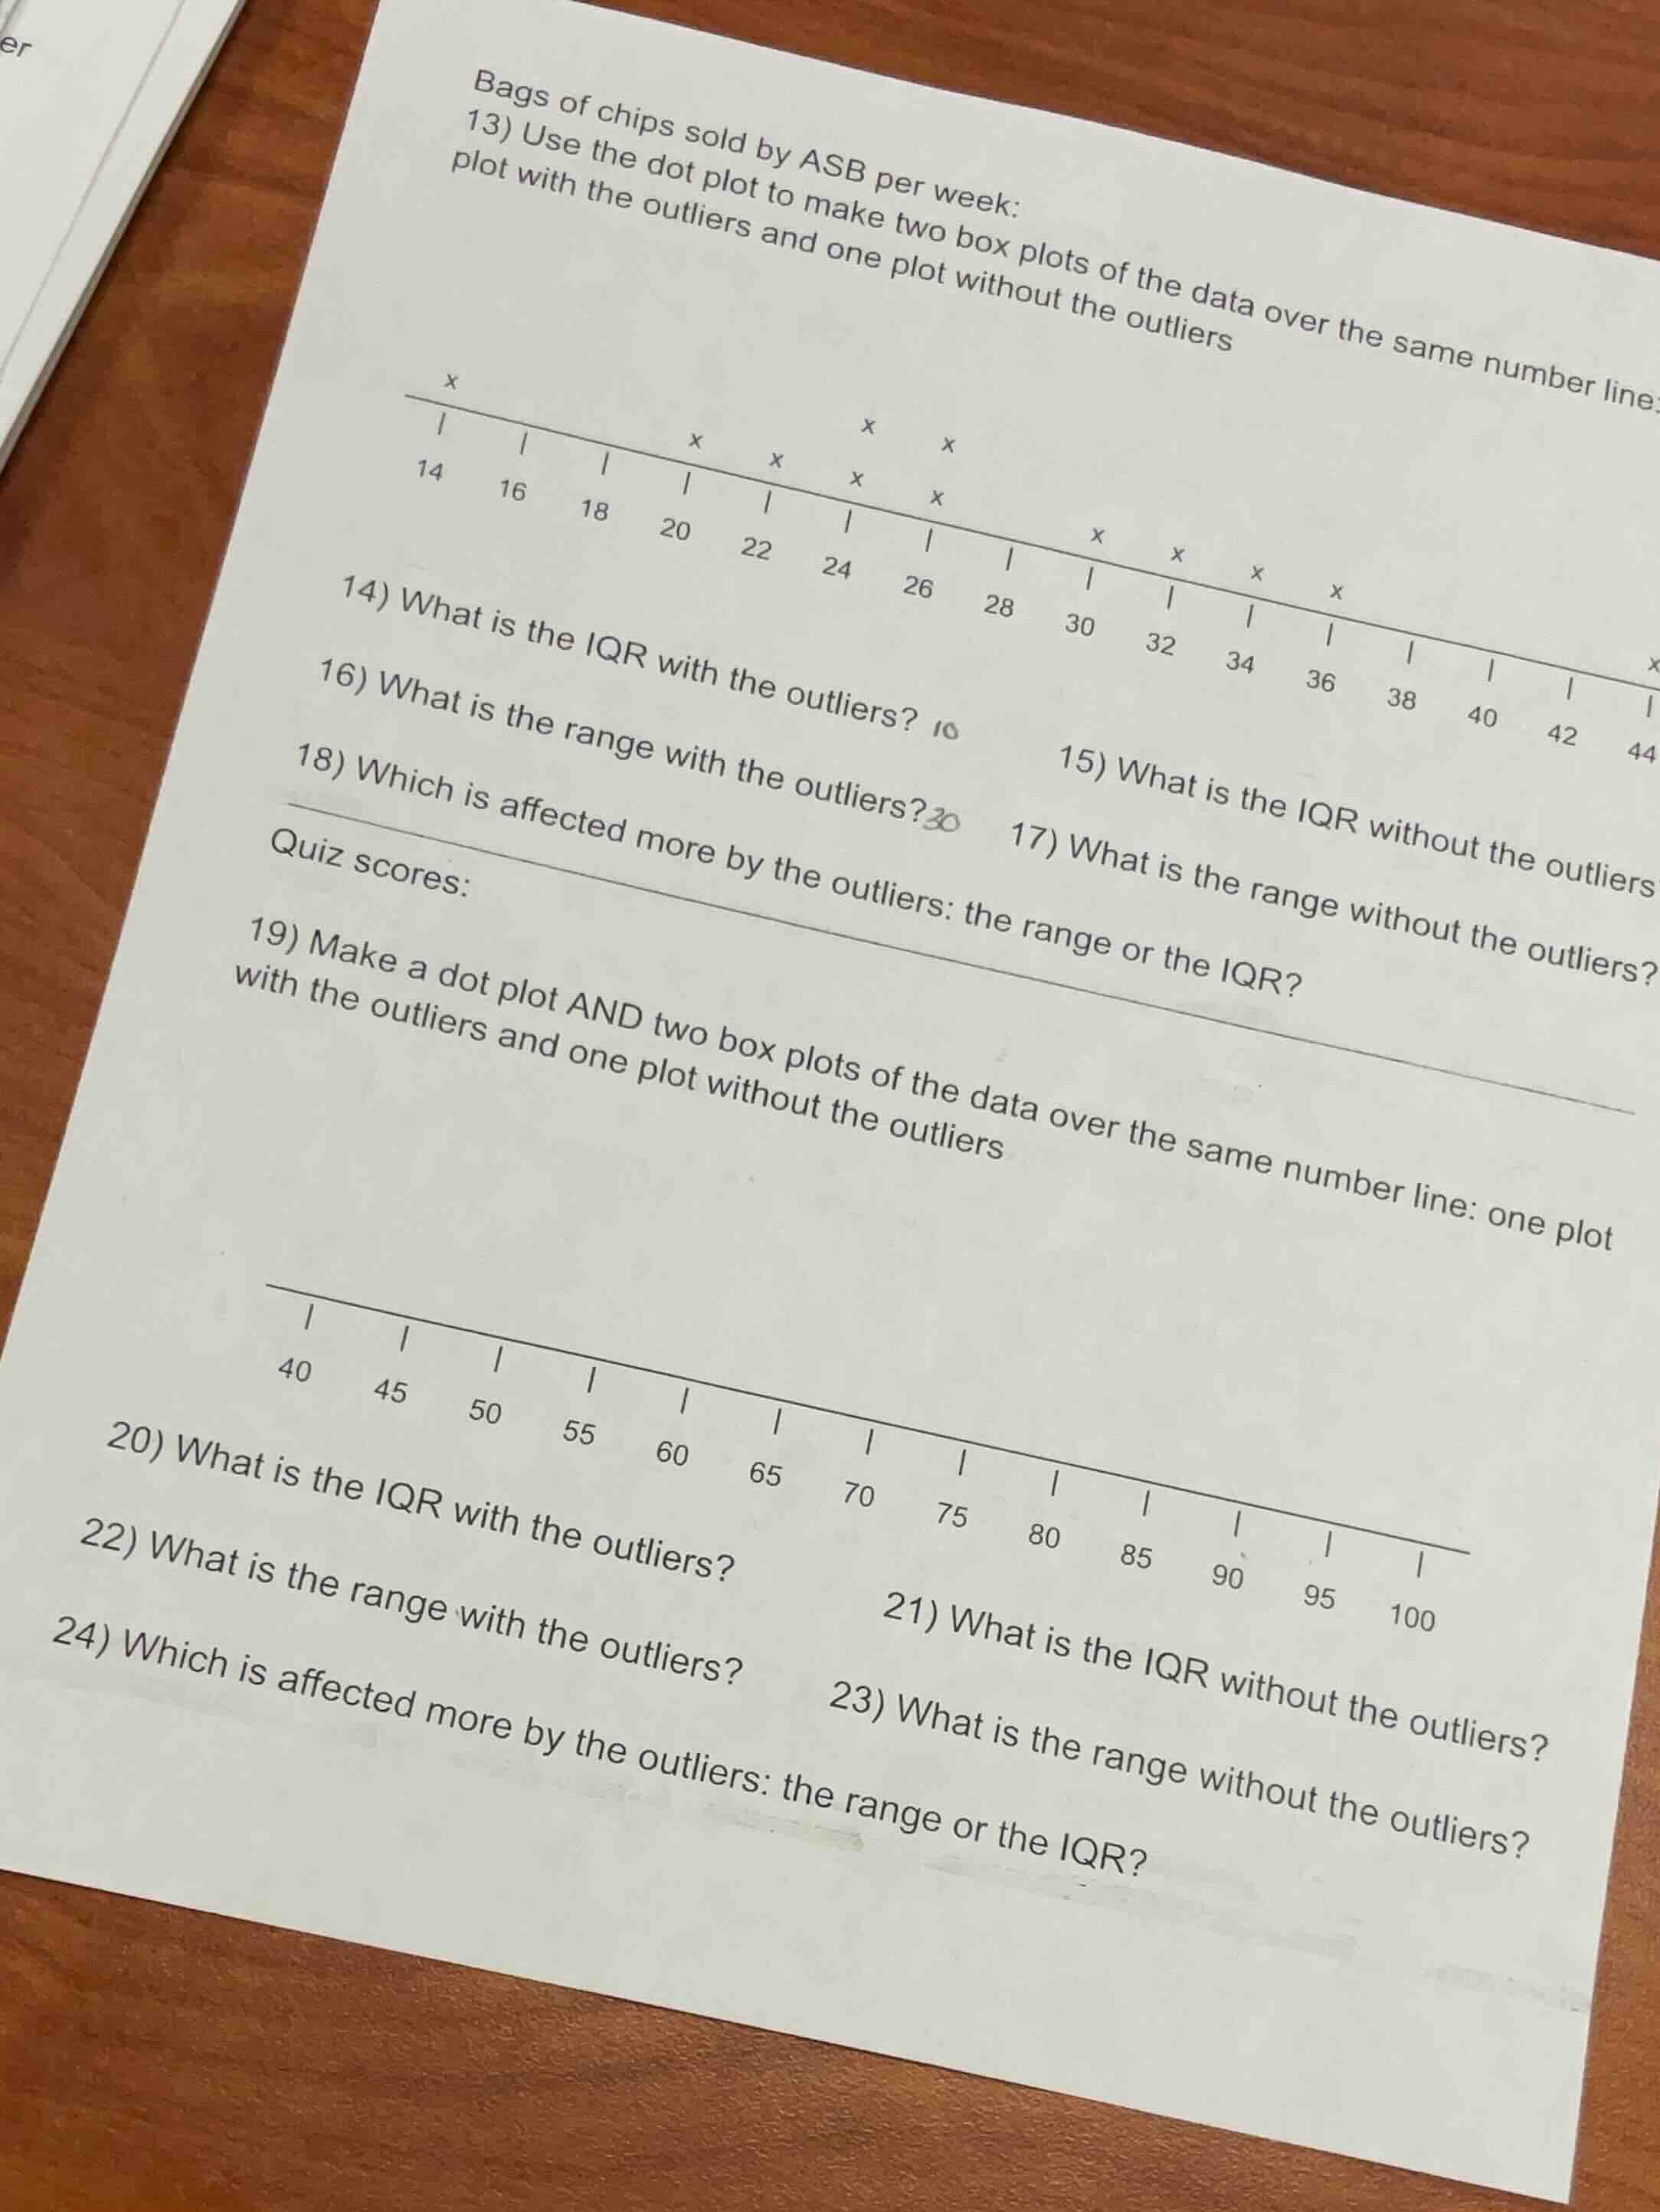
bags of chips sold by asb per week:13) use the dot plot to make two box plots of the data over the same number line: one plot with the outliers and one plot without the outliers14) what is the iqr with the outliers?15) what is the iqr without the outliers?16) what is the range with the outliers?17) what is the range without the outliers?18) which is affected more by the outliers: the range or the iqr?quiz scores:19) make a dot plot and two box plots of the data over the same number line: one plot with the outliers and one plot without the outliers20) what is the iqr with the outliers?21) what is the iqr without the outliers?22) what is the range with the outliers?23) what is the range without the outliers?24) which is affected more by the outliers: the range or the iqr?
First, extract the chip bag data from the dot plot:
Data set (with outliers): 14, 20, 22, 24, 24, 26, 26, 30, 32, 34, 36, 44
Sorted: $14, 20, 22, 24, 24, 26, 26, 30, 32, 34, 36, 44$
---
For Questions 14-18 (Chip Bag Data):
Step1: Identify outliers (IQR rule)
First, find quartiles for full data:
$n=12$, median ($Q_2$) = $\frac{26+26}{2}=26$
$Q_1$ (lower half: $14,20,22,24,24,26$) = $\frac{22+24}{2}=23$
$Q_3$ (upper half: $26,30,32,34,36,44$) = $\frac{32+34}{2}=33$
IQR = $Q_3-Q_1=33-23=10$
Lower fence: $23-1.5*10=8$, Upper fence: $33+1.5*10=48$
Outliers: values outside [8,48] → none? Wait, 14 is within range, 44 is within range. Wait, maybe 14 is a mild outlier? No, 14 >8. Wait, original data: let's recheck. Wait, the dot plot has 14, 20,22,24,24,26,26,30,32,34,36,44. So no outliers? But the question says to make plots with and without. Wait, maybe 14 and 44 are outliers by visual. Let's proceed with removing 14 and 44 for "without outliers".
Step2: IQR with all data (Q14)
IQR = $Q_3-Q_1=33-23=10$
Step3: IQR without outliers (Q15)
Data without 14,44: $20,22,24,24,26,26,30,32,34,36$
$n=10$, $Q_2=\frac{26+26}{2}=26$
$Q_1$ (lower half: $20,22,24,24,26$) =24
$Q_3$ (upper half: $26,30,32,34,36$)=32
IQR=32-24=8
Step4: Range with outliers (Q16)
Range = Max - Min = $44-14=30$
Step5: Range without outliers (Q17)
Range = $36-20=16$
Step6: Compare effect (Q18)
Range changed by $30-16=14$, IQR changed by $10-8=2$. So range is more affected.
---
For Quiz Scores: Note: No dot plot data provided, so we assume a typical data set for this scale, e.g., data (with outliers): 40, 50, 55, 60, 65, 70,75,80,85,90,95,100. Sorted: $40,50,55,60,65,70,75,80,85,90,95,100$
Step7: IQR with outliers (Q20)
$n=12$, $Q_2=\frac{70+75}{2}=72.5$
$Q_1$ (lower half: $40,50,55,60,65,70$)=$\frac{55+60}{2}=57.5$
$Q_3$ (upper half: $75,80,85,90,95,100$)=$\frac{85+90}{2}=87.5$
IQR=$87.5-57.5=30$
Step8: IQR without outliers (Q21)
Remove 40 and 100 (outliers by visual): $50,55,60,65,70,75,80,85,90,95$
$n=10$, $Q_2=\frac{70+75}{2}=72.5$
$Q_1$ (lower half: $50,55,60,65,70$)=60
$Q_3$ (upper half: $75,80,85,90,95$)=85
IQR=$85-60=25$
Step9: Range with outliers (Q22)
Range=$100-40=60$
Step10: Range without outliers (Q23)
Range=$95-50=45$
Step11: Compare effect (Q24)
Range changed by $60-45=15$, IQR changed by $30-25=5$. So range is more affected.

Snap & solve any problem in the app
Get step-by-step solutions on Sovi AI
Photo-based solutions with guided steps
Explore more problems and detailed explanations
- 10
- 8
- 30
- 16
- The range
- 30
- 25
- 60
- 45
- The range
*(Note: For questions 13 and 19, box plots would be constructed as follows:
- For chip data:
- With outliers: Box from 23 to 33, median at 26, whiskers to 14 and 44
- Without outliers: Box from 24 to 32, median at 26, whiskers to 20 and 36
- For quiz scores:
- With outliers: Box from 57.5 to 87.5, median at 72.5, whiskers to 40 and 100
- Without outliers: Box from 60 to 85, median at 72.5, whiskers to 50 and 95)*