QUESTION IMAGE
Question
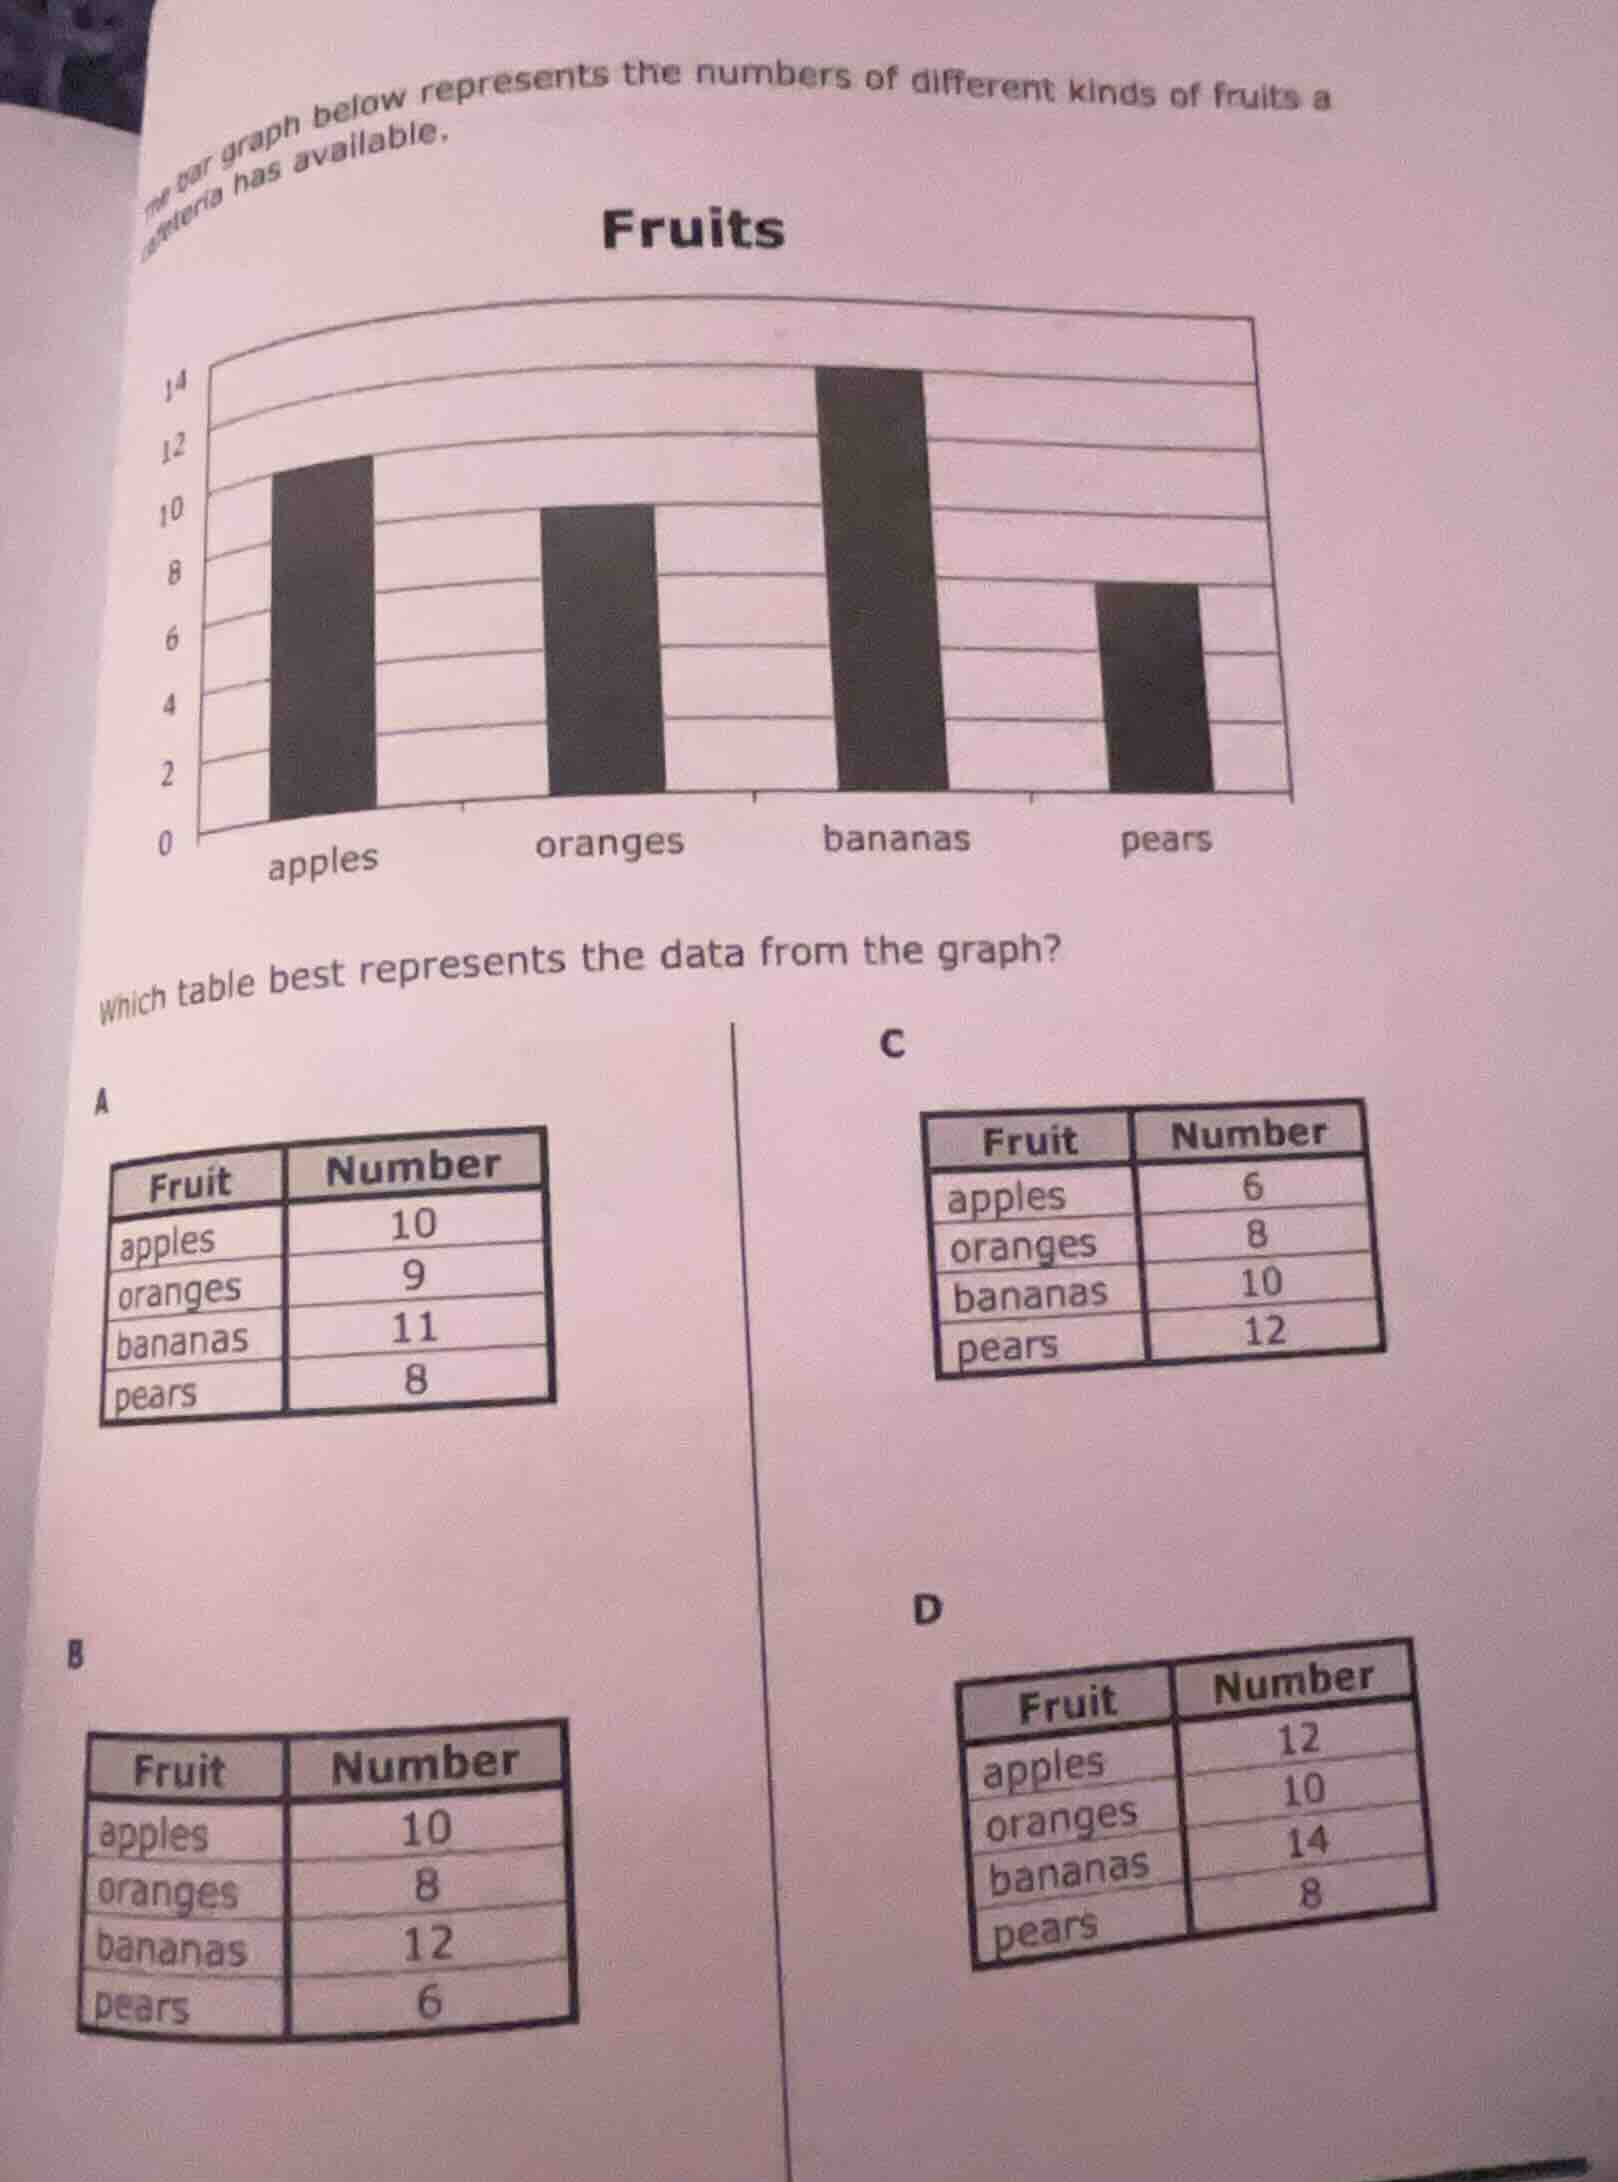
the bar graph below represents the numbers of different kinds of fruits a cafeteria has available.
bar graph titled fruits with categories: apples, oranges, bananas, pears. y - axis (number) from 0 to 14. apples bar reaches 10, oranges bar reaches 8, bananas bar reaches 14, pears bar reaches 6? wait, no, looking at the image again: apples: height around 10 - 12? wait, the users image: apples bar is at 10 - 12? wait, the ocr texts graph: apples, oranges, bananas, pears. lets re - extract: the bar graph for fruits: apples (height ~10 - 12? wait, the original image: apples bar is at 10 (since the y - axis has 0,2,4,6,8,10,12,14). apples: up to 10? wait, no, the users image: apples bar is between 10 and 12? wait, maybe better to go by the tables. the question: which table best represents the data from the graph?
tables:
a: fruit - number: apples 10, oranges 9, bananas 11, pears 8
b: fruit - number: apples 10, oranges 8, bananas 12, pears 6
c: fruit - number: apples 6, oranges 8, bananas 10, pears 12
d: fruit - number: apples 12, oranges 10, bananas 14, pears 8
Step1: Analizar el gráfico de barras
Observar la altura de cada barra:
- Manzanas (apples): La barra alcanza hasta 10.
- Naranjas (oranges): La barra alcanza hasta 8.
- Plátanos (bananas): La barra alcanza hasta 12.
- Peras (pears): La barra alcanza hasta 6.
Step2: Comparar con las tablas
Revisar cada tabla:
- Tabla A: Manzanas 10, naranjas 9 (no coincide), plátanos 11 (no coincide), peras 8 (no coincide).
- Tabla B: Manzanas 10, naranjas 8, plátanos 12, peras 6 (coincide con el gráfico).
- Tabla C: Manzanas 6 (no coincide), naranjas 8, plátanos 10 (no coincide), peras 12 (no coincide).
- Tabla D: Manzanas 12 (no coincide), naranjas 10 (no coincide), plátanos 14 (no coincide), peras 8 (no coincide).

Snap & solve any problem in the app
Get step-by-step solutions on Sovi AI
Photo-based solutions with guided steps
Explore more problems and detailed explanations
B. Fruit - Number: apples 10, oranges 8, bananas 12, pears 6