QUESTION IMAGE
Question
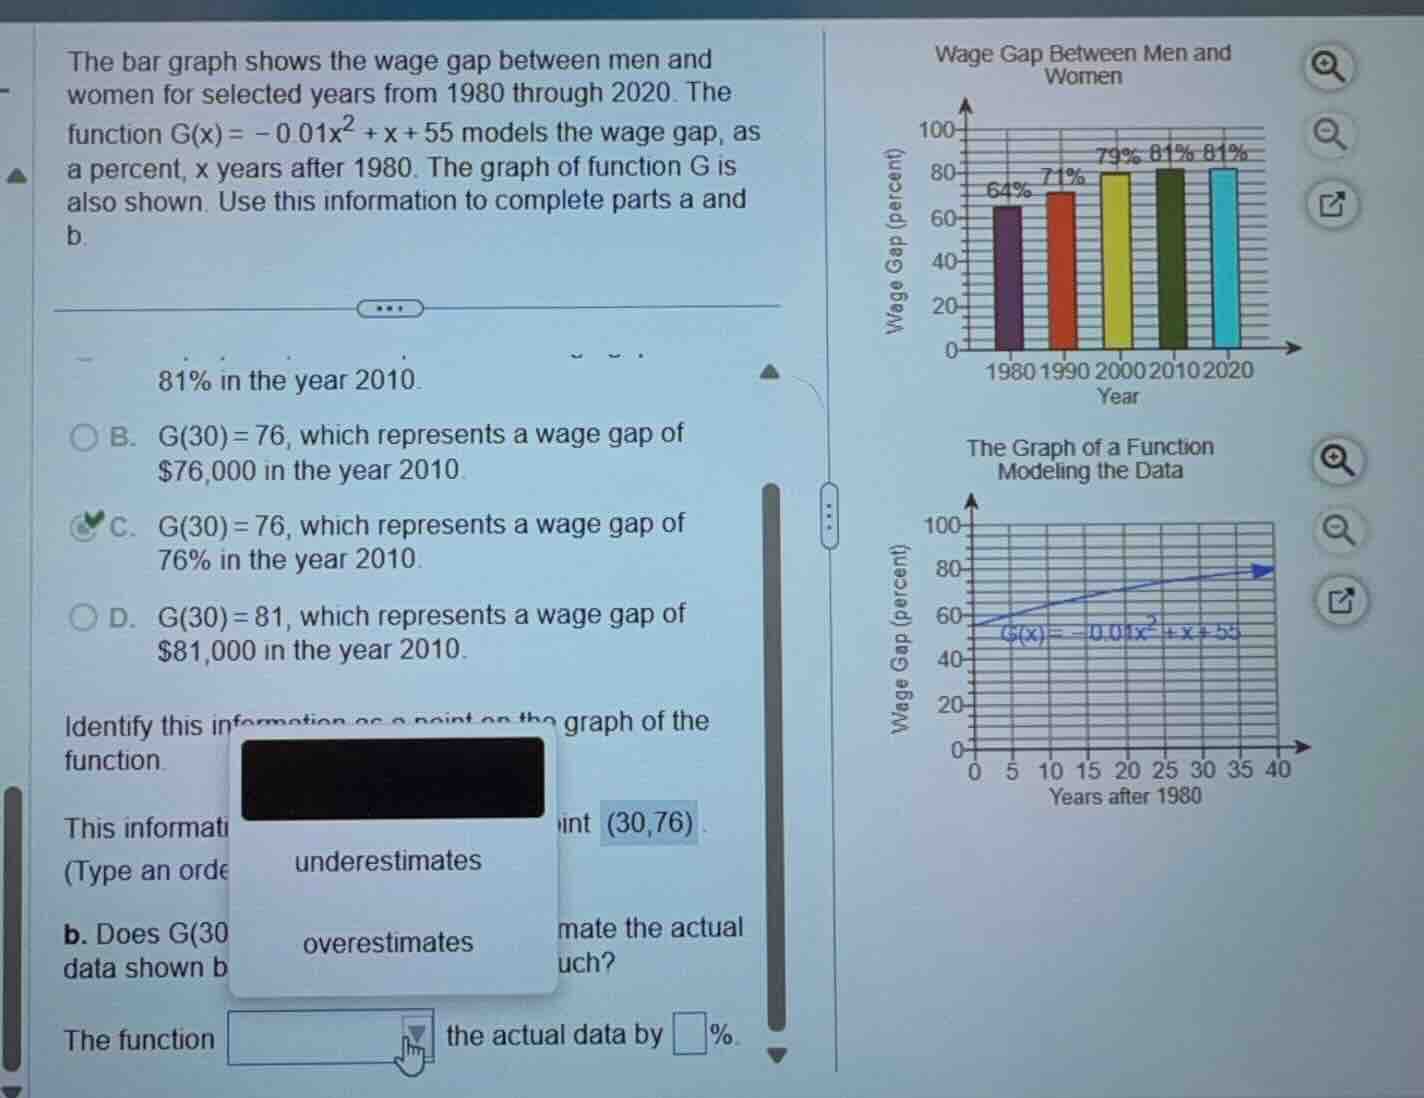
the bar graph shows the wage gap between men and women for selected years from 1980 through 2020. the function ( g(x) = -0.01x^2 + x + 55 ) models the wage gap, as a percent, ( x ) years after 1980. the graph of function ( g ) is also shown. use this information to complete parts a and b. 81% in the year 2010. b. ( g(30) = 76 ), which represents a wage gap of $76,000 in the year 2010. c. ( g(30) = 76 ), which represents a wage gap of 76% in the year 2010. d. ( g(30) = 81 ), which represents a wage gap of $81,000 in the year 2010. identify this information as a point on the graph of the function. this informati (type an orde b. does ( g(30) ) mate the actual data shown b the function the actual data by %.)
Step1: Calculate G(30)
Substitute $x=30$ into $G(x)$:
$$G(30) = -0.01(30)^2 + 30 + 55$$
$$G(30) = -0.01(900) + 30 + 55$$
$$G(30) = -9 + 30 + 55 = 76$$
Step2: Get actual 2010 wage gap
From bar graph, 2010 gap = 81%
Step3: Compare model and actual value
$76 < 81$, so model underestimates.
Step4: Find difference
$$81 - 76 = 5$$

Snap & solve any problem in the app
Get step-by-step solutions on Sovi AI
Photo-based solutions with guided steps
Explore more problems and detailed explanations
For part b:
The function underestimates the actual data by 5%.
For the point identification: (30,76)