QUESTION IMAGE
Question
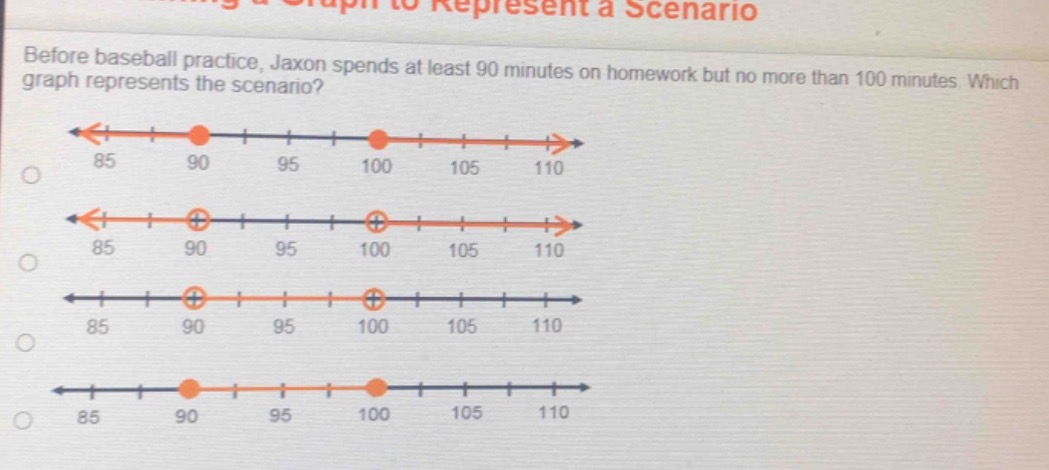
before baseball practice, jaxon spends at least 90 minutes on homework but no more than 100 minutes. which graph represents the scenario? 85 90 95 100 105 110 85 90 95 100 105 110 85 90 95 100 105 110 85 90 95 100 105 110
Step1: Understand the inequality
Jaxon spends at least 90 minutes (so \( t \geq 90 \)) and no more than 100 minutes (so \( t \leq 100 \)). This means the time \( t \) is between 90 and 100, including both endpoints.
Step2: Analyze the number line symbols
- A closed (filled) circle means the number is included (for \( \geq \) or \( \leq \)).
- An open (unfilled) circle means the number is not included (for \( > \) or \( < \)).
For \( t \geq 90 \) and \( t \leq 100 \), we need closed circles at 90 and 100, and the line between them shaded.
Looking at the options:
- First option: Closed circles at 90 and 100, but the line is shaded outside (left of 90 and right of 100) – incorrect.
- Second option: Open circles at 90 and 100 – incorrect (we need closed circles for inclusion).
- Third option: Open circles and shaded outside the middle – incorrect.
- Fourth option: Closed circles at 90 and 100, and the line between them (90 to 100) is shaded – correct.

Snap & solve any problem in the app
Get step-by-step solutions on Sovi AI
Photo-based solutions with guided steps
Explore more problems and detailed explanations
The fourth graph (with closed circles at 90 and 100, and the segment between them shaded).