QUESTION IMAGE
Question
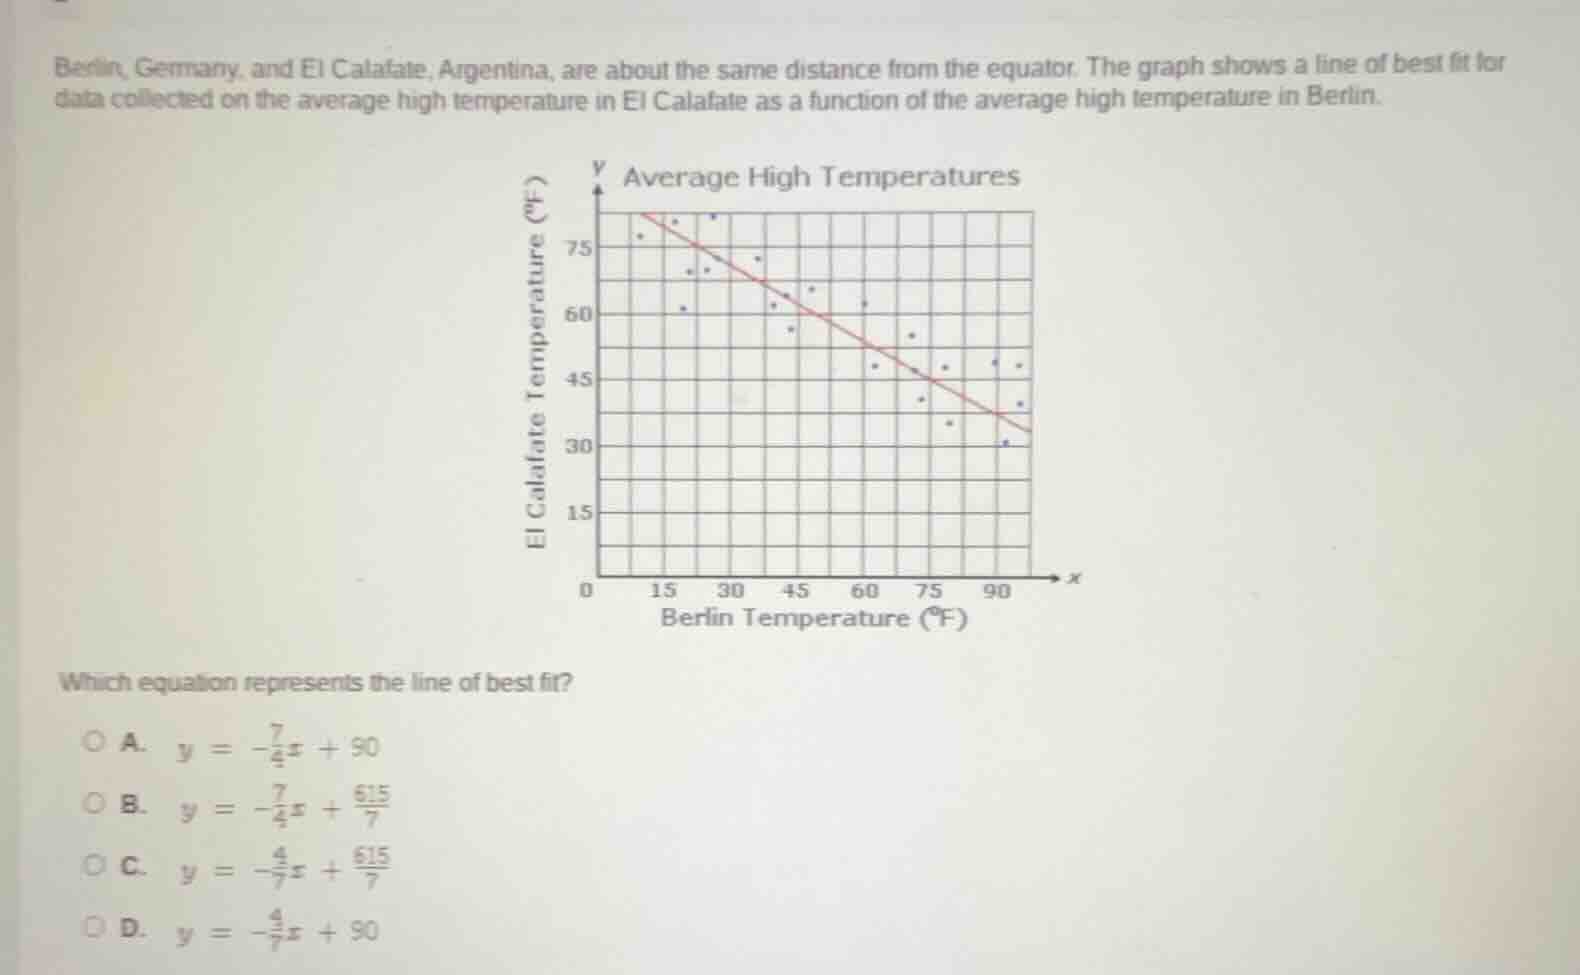
berlin, germany, and el calafate, argentina, are about the same distance from the equator. the graph shows a line of best fit for data collected on the average high temperature in el calafate as a function of the average high temperature in berlin.
average high temperatures
which equation represents the line of best fit?
a. $y = -\frac{7}{4}x + 90$
b. $y = -\frac{7}{4}x + \frac{615}{7}$
c. $y = -\frac{4}{7}x + \frac{615}{7}$
d. $y = -\frac{4}{7}x + 90$
Step1: Identify two points on line
Choose clear points: $(x_1,y_1)=(0,90)$ (y-intercept) and $(x_2,y_2)=(70,50)$
Step2: Calculate slope $m$
Slope formula: $m=\frac{y_2-y_1}{x_2-x_1}$
$m=\frac{50-90}{70-0}=\frac{-40}{70}=-\frac{4}{7}$
Step3: Write line equation
Use $y=mx+b$, $b=90$
$y=-\frac{4}{7}x+90$
Step4: Match with options
Compare to given choices.

Snap & solve any problem in the app
Get step-by-step solutions on Sovi AI
Photo-based solutions with guided steps
Explore more problems and detailed explanations
D. $y = -\frac{4}{7}x + 90$