QUESTION IMAGE
Question
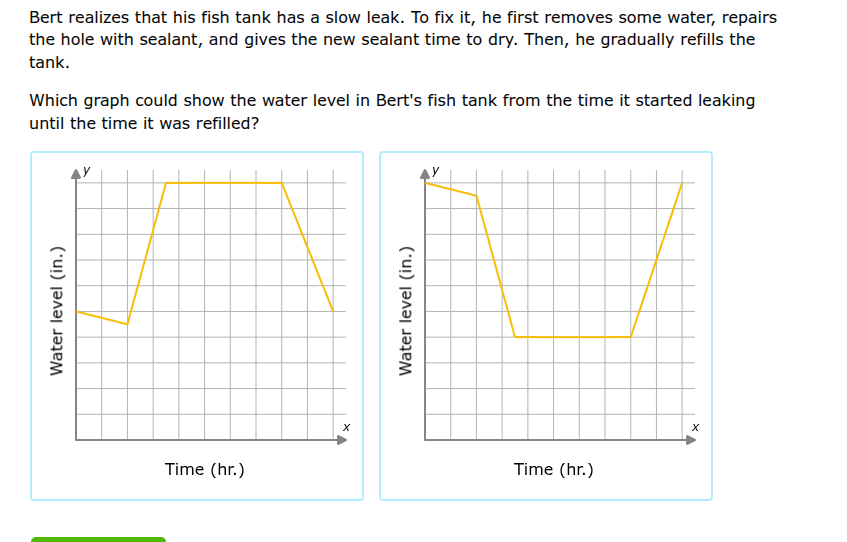
bert realizes that his fish tank has a slow leak. to fix it, he first removes some water, repairs the hole with sealant, and gives the new sealant time to dry. then, he gradually refills the tank. which graph could show the water level in berts fish tank from the time it started leaking until the time it was refilled?
Brief Explanations
- Leak phase: Water level slowly decreases (matches the first downward slope on the right graph).
- Remove water phase: Water level drops quickly (matches the steep downward slope on the right graph).
- Sealant dry phase: Water level stays constant (matches the flat horizontal line on the right graph).
- Refill phase: Water level rises quickly to its original level (matches the steep upward slope on the right graph).
The left graph incorrectly shows the water level rising above its original starting point, which does not match the scenario of refilling the tank.

Snap & solve any problem in the app
Get step-by-step solutions on Sovi AI
Photo-based solutions with guided steps
Explore more problems and detailed explanations
The graph on the right (second graph)