QUESTION IMAGE
Question
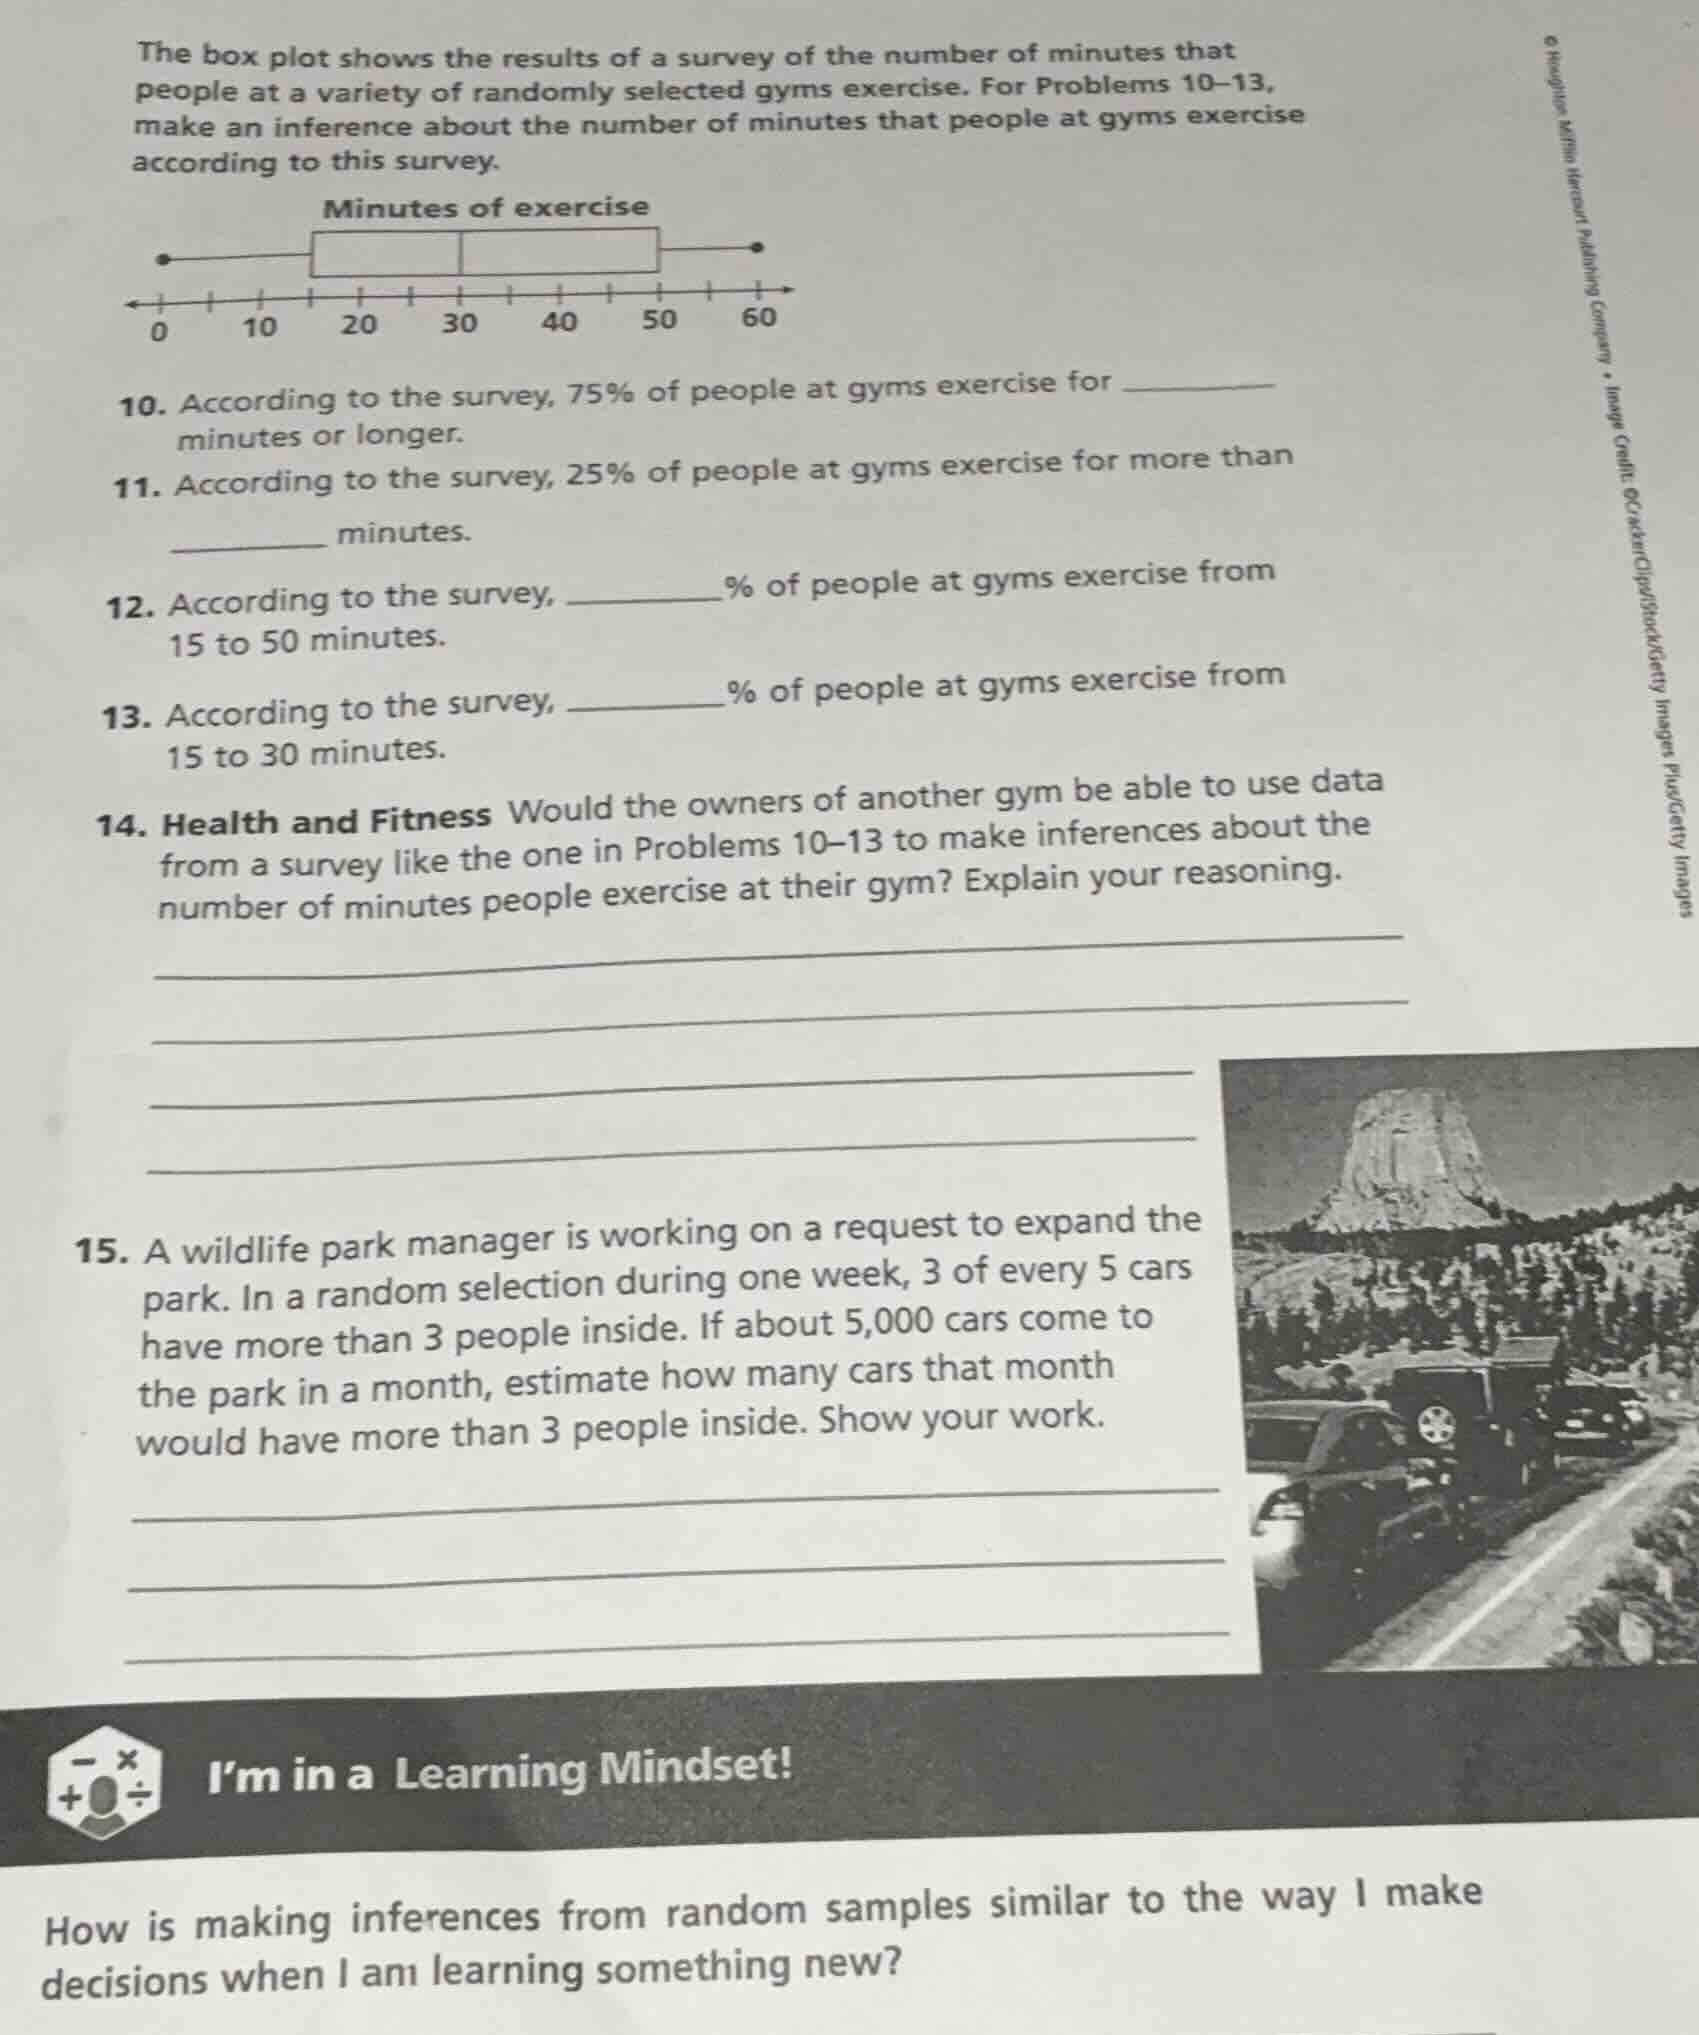
the box plot shows the results of a survey of the number of minutes that people at a variety of randomly selected gyms exercise. for problems 10–13, make an inference about the number of minutes that people at gyms exercise according to this survey. minutes of exercise 0 10 20 30 40 50 60 10. according to the survey, 75% of people at gyms exercise for ____ minutes or longer. 11. according to the survey, 25% of people at gyms exercise for more than __ minutes. 12. according to the survey, __% of people at gyms exercise from 15 to 50 minutes. 13. according to the survey, ____% of people at gyms exercise from 15 to 30 minutes. 14. health and fitness would the owners of another gym be able to use data from a survey like the one in problems 10–13 to make inferences about the number of minutes people exercise at their gym? explain your reasoning. 15. a wildlife park manager is working on a request to expand the park. in a random selection during one week, 3 of every 5 cars have more than 3 people inside. if about 5,000 cars come to the park in a month, estimate how many cars that month would have more than 3 people inside. show your work. how is making inferences from random samples similar to the way i make decisions when i am learning something new?
Problem 10
Step1: Recall box plot quartiles
In a box plot, the left edge of the box is \( Q_1 \) (25th percentile), the middle is the median (\( Q_2 \), 50th percentile), and the right edge is \( Q_3 \) (75th percentile). The left whisker starts at the minimum, and the right whisker ends at the maximum. From the box plot, the left edge of the box (where the box starts) is at 15? Wait, no, looking at the axis: the box starts at 15? Wait, the x - axis is 0, 10, 15? Wait, no, the ticks are 0, 10, 20, 30, 40, 50, 60. Wait, the box is from 15? Wait, no, the first vertical line of the box (the lower quartile \( Q_1 \)): Wait, the box plot has the box with left side at 15? Wait, no, the problem says "75% of people at gyms exercise for __ minutes or longer". 75% or longer means the 25th percentile? No, wait: 75% of the data is at or above \( Q_1 \) (25th percentile), and 25% is at or above \( Q_3 \) (75th percentile). Wait, no: In a box plot, \( Q_1 \) is the 25th percentile (25% of data is below \( Q_1 \), 75% is above or equal to \( Q_1 \)), \( Q_3 \) is the 75th percentile (75% of data is below or equal to \( Q_3 \), 25% is above \( Q_3 \)). Wait, the question is "75% of people at gyms exercise for minutes or longer". So that means 75% of the data is greater than or equal to that value. So that value is \( Q_1 \) (25th percentile). Looking at the box plot, the left side of the box (where the box starts) is at 15? Wait, the x - axis ticks: 0, 10, 15? No, the ticks are 0, 10, 20, 30, 40, 50, 60. Wait, maybe the box starts at 15? Wait, no, the first vertical line of the box (lower quartile) is at 15? Wait, the problem's box plot: the left end of the box is at 15? Wait, the user's box plot: "Minutes of exercise" with the box from, let's see, the first part of the box is from 15 to 30, and the second part from 30 to 50? Wait, no, the box is divided into two parts, maybe the median is at 30. Wait, the left side of the box ( \( Q_1 \)): if we look at the x - axis, the first vertical line of the box (the start of the box) is at 15? Wait, the question 10: 75% of people exercise for __ minutes or longer. So 75% or longer means that 25% are below. So that's \( Q_1 \), the 25th percentile. From the box plot, the left side of the box (where the box begins) is at 15? Wait, maybe the box starts at 15. So the answer is 15? Wait, no, maybe I got it reversed. Wait, 75% of the data is at or above \( Q_1 \) (25th percentile), and 25% is at or above \( Q_3 \) (75th percentile). So the question is 75% or longer: so that's \( Q_1 \). Let's assume the box plot's \( Q_1 \) is 15. So 75% of people exercise for 15 minutes or longer.
Step2: Confirm with box plot structure
In a box - and - whisker plot, the lower quartile (\( Q_1 \)) is the value where 25% of the data is below it and 75% is above or equal to it. So if the box starts at 15 ( \( Q_1 = 15 \) ), then 75% of the data is \( \geq15 \).
Step1: Recall box plot quartiles
25% of people exercise for more than ____ minutes. 25% more than means that 75% of the data is below or equal to that value. That value is the upper quartile (\( Q_3 \)). From the box plot, the right side of the box ( \( Q_3 \)) is at 50? Wait, the box ends at 50? Wait, the box plot: the right side of the box is at 50. So \( Q_3 = 50 \), which means 75% of the data is \( \leq50 \), so 25% of the data is \( > 50 \).
Step2: Confirm with quartile definition
The upper quartile (\( Q_3 \)) is the value where 75% of the data is below or equal to it and 25% is above it. So if \( Q_3 = 50 \), then 25% of people exercise for more than 50 minutes.
Step1: Identify the range and quartiles
We need to find the percentage of people who exercise from 15 to 50 minutes. From the box plot, 15 is \( Q_1 \) (25th percentile) and 50 is \( Q_3 \) (75th percentile). The inter - quartile range (IQR) is from \( Q_1 \) to \( Q_3 \), and the percentage of data in the IQR is 50%? Wait, no: Wait, \( Q_1 \) is 25th percentile, \( Q_3 \) is 75th percentile. So the percentage of data between \( Q_1 \) and \( Q_3 \) is \( 75\% - 25\%=50\% \)? Wait, no, wait: If \( Q_1 = 15 \) and \( Q_3 = 50 \), then the data from 15 to 50 is the inter - quartile range, which contains 50% of the data? Wait, no, the inter - quartile range (IQR) is the range of the middle 50% of the data. Wait, no: The percentage of data between \( Q_1 \) and \( Q_3 \) is \( 75 - 25=50\% \). Wait, but let's check again. The data below \( Q_1 \) (15) is 25%, the data above \( Q_3 \) (50) is 25%, so the data between 15 and 50 is \( 100\% - 25\% - 25\% = 50\% \)? Wait, no, that's not right. Wait, \( Q_1 \) is 25th percentile, \( Q_3 \) is 75th percentile. So the proportion of data between \( Q_1 \) and \( Q_3 \) is \( 75\% - 25\%=50\% \)? Wait, no, the data from \( Q_1 \) to \( Q_3 \) is the middle 50%? Wait, no, the median is at 30 (the middle of the box). Wait, maybe I made a mistake. Wait, the box is from 15 to 50, with the median at 30. So the data from 15 to 50: the lower 25% is below 15, the upper 25% is above 50, so the middle 50% is between 15 and 50? No, wait, the quartiles: \( Q_1 \) (25th), median (50th), \( Q_3 \) (75th). So the data from \( Q_1 \) to \( Q_3 \) is 50% of the data (from 25th to 75th percentile). So if \( Q_1 = 15 \) and \( Q_3 = 50 \), then the percentage of data between 15 and 50 is \( 75\% - 25\% = 50\% \)? Wait, no, that can't be. Wait, no, the data from 15 to 50: the number of people with exercise time \( \geq15 \) and \( \leq50 \). We know that 75% are \( \geq15 \) (from problem 10) and 75% are \( \leq50 \) (from problem 11, since 25% are \( > 50 \)). So the percentage of data between 15 and 50 is \( 75\%+75\% - 100\%=50\% \)? Wait, using the formula for the intersection: \( P(15\leq x\leq50)=P(x\geq15)+P(x\leq50)- 1\). Since \( P(x\geq15) = 0.75 \) and \( P(x\leq50)=0.75 \), then \( P(15\leq x\leq50)=0.75 + 0.75-1 = 0.5 = 50\% \).
Step2: Confirm with quartile ranges
The lower quartile (\( Q_1 = 15 \)) and upper quartile (\( Q_3 = 50 \)). The percentage of data between \( Q_1 \) and \( Q_3 \) is \( 75\% - 25\%=50\% \) (since \( Q_1 \) is 25th percentile and \( Q_3 \) is 75th percentile).

Snap & solve any problem in the app
Get step-by-step solutions on Sovi AI
Photo-based solutions with guided steps
Explore more problems and detailed explanations
15