QUESTION IMAGE
Question
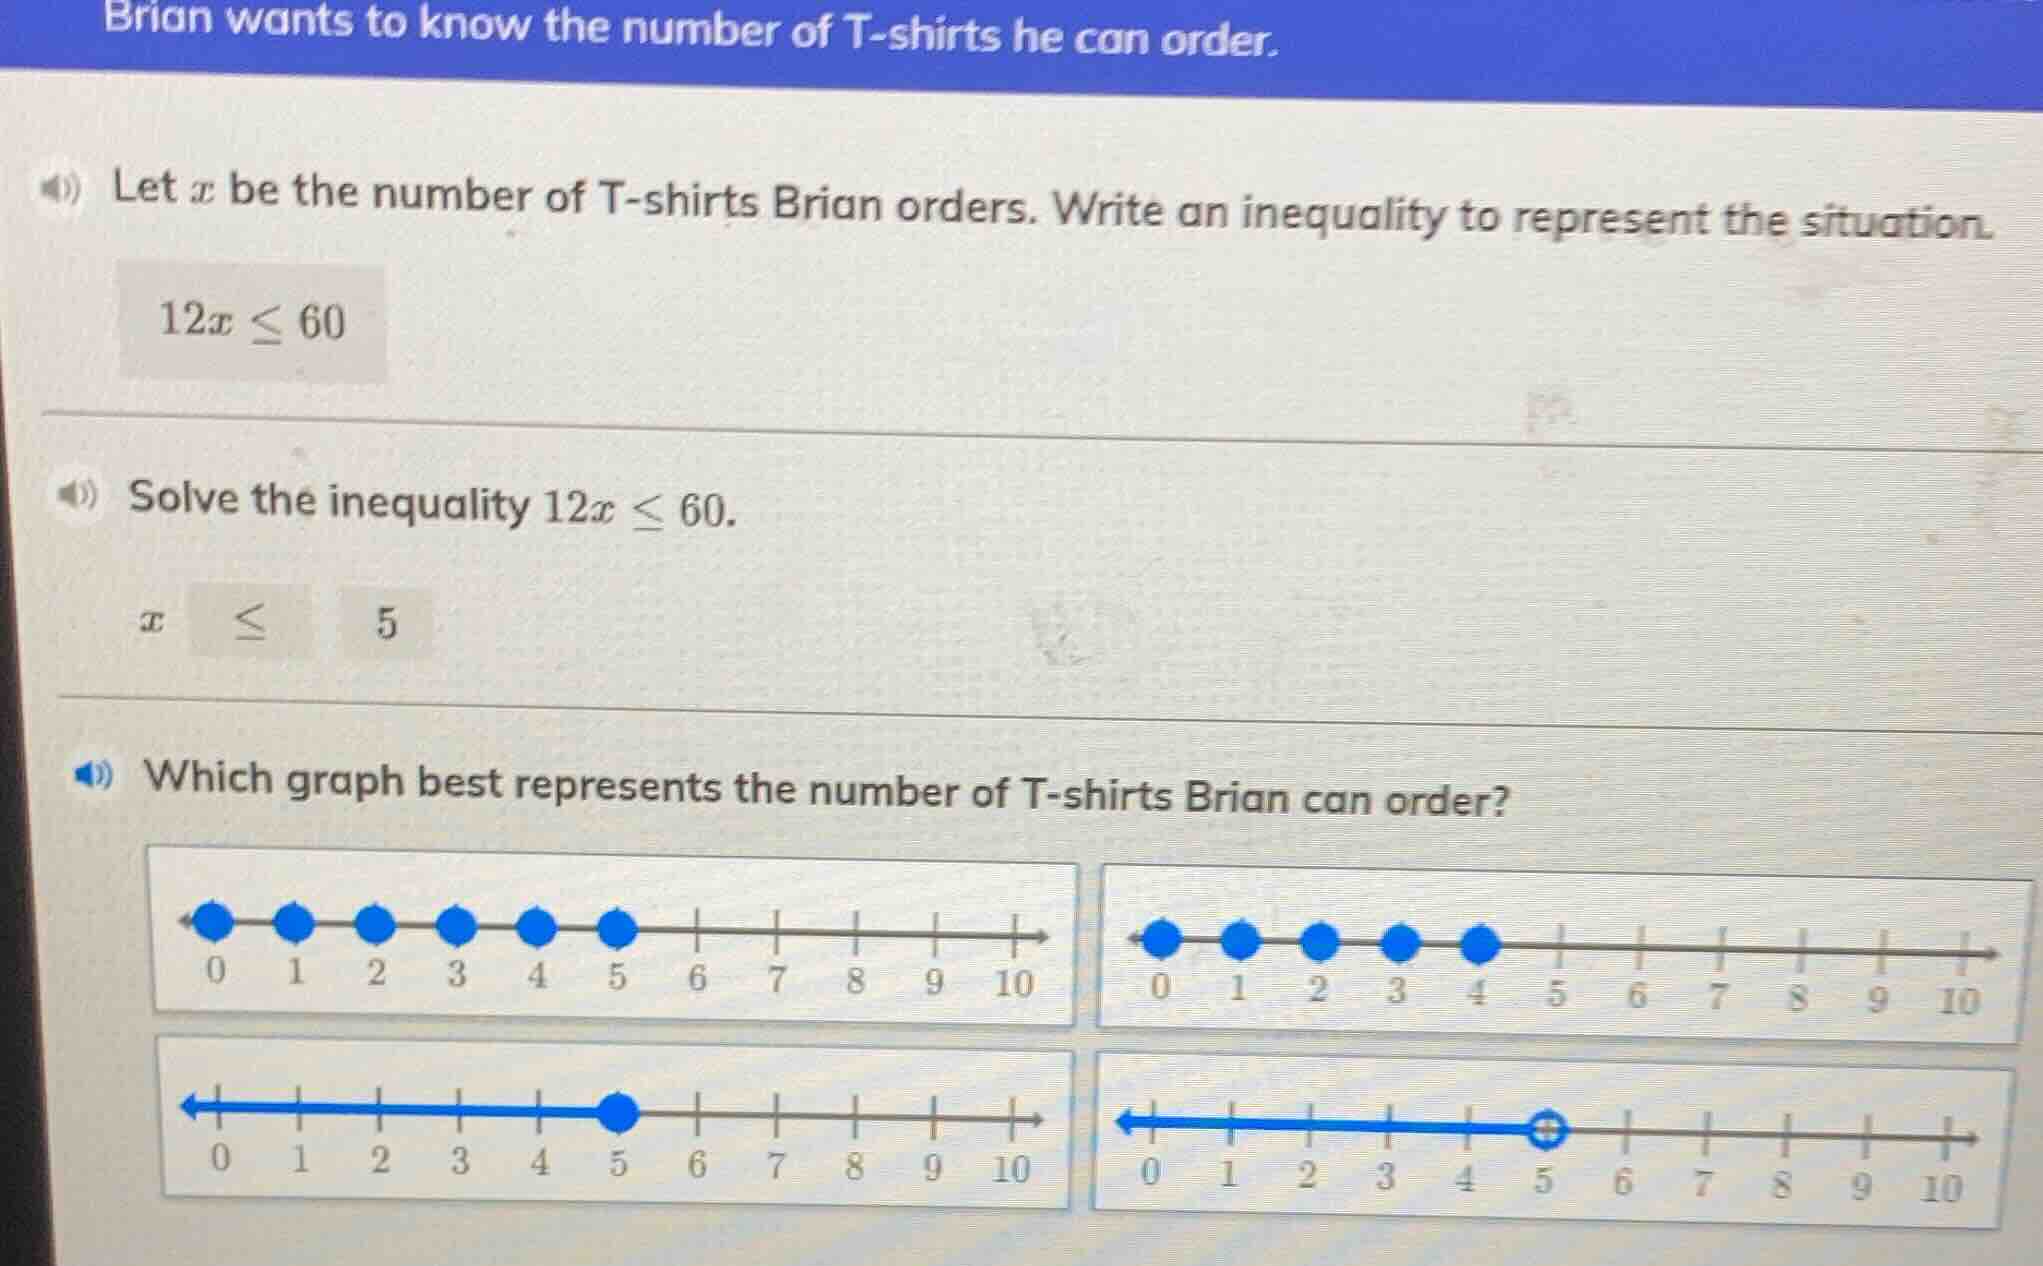
brian wants to know the number of t - shirts he can order. let x be the number of t - shirts brian orders. write an inequality to represent the situation. 12x ≤ 60 solve the inequality 12x ≤ 60. x ≤ 5 which graph best represents the number of t - shirts brian can order? (four number line graphs are shown, the first has blue dots at 0,1,2,3,4,5; the second has blue dots at 0,1,2,3,4; the third has a blue line with a blue dot at 5; the fourth has a blue line with an open circle at 5)
Sub - question 1: Write an inequality
Step1: Analyze the situation
Let \(x\) be the number of T - shirts. If each T - shirt costs $12 and the total budget is $60, the total cost \(12x\) should be less than or equal to 60.
Step2: Write the inequality
The inequality is \(12x\leq60\).
Step1: Isolate \(x\)
To solve for \(x\), divide both sides of the inequality \(12x\leq60\) by 12. Since 12 is a positive number, the direction of the inequality sign remains the same.
\(\frac{12x}{12}\leq\frac{60}{12}\)
Step2: Simplify
Simplifying both sides, we get \(x\leq5\).
The solution to the inequality \(x\leq5\) where \(x\) represents the number of T - shirts (a non - negative integer, since you can't order a negative number of T - shirts) means that \(x = 0,1,2,3,4,5\). Also, in terms of a number line for real numbers (if we consider \(x\) as a real number representing the count, although in context it's a non - negative integer), the graph should have a closed circle at 5 (because the inequality is \(\leq\)) and the line should extend to the left. But since the number of T - shirts is a non - negative integer, the graph with blue dots at 0,1,2,3,4,5 (the first row second graph? Wait, looking at the options: The first graph in the first row has dots up to 5 and 6? No, wait the first graph in the first row: dots at 0,1,2,3,4,5,6? No, the second graph in the first row has dots at 0,1,2,3,4,5. Wait, the third graph is a number line with a closed circle at 5 and line to the left. But since the number of T - shirts is a discrete quantity (you can't order a fraction of a T - shirt), the graph with blue dots at 0,1,2,3,4,5 (the second graph in the first row? Wait, no, the third graph is for real numbers. Wait, the problem says "the number of T - shirts", which is a non - negative integer. So the graph that shows the integers from 0 to 5 inclusive. Looking at the options: The second graph in the first row (the one with dots at 0,1,2,3,4,5) or the third graph? Wait, no, the third graph is a number line with a closed circle at 5 and the line going to the left (for real numbers). But since \(x\) is the number of T - shirts, it's a non - negative integer. So the correct graph is the one with blue dots at 0,1,2,3,4,5 (the second graph in the first row? Wait, the first graph in the first row has a dot at 6, which is wrong. The second graph in the first row has dots at 0 - 5. The third graph is a number line (for real numbers) with a closed circle at 5. Since the number of T - shirts is a discrete variable, but sometimes in math problems, even if it's discrete, we can represent it on a number line with a closed circle at 5 and the line to the left (including all real numbers less than or equal to 5). But since the inequality is \(x\leq5\) and \(x\geq0\) (because you can't order negative T - shirts), the correct graph is the third one (the one with a closed circle at 5 and the line going to the left from 5, starting from 0). Wait, the third graph: the number line has a closed circle at 5 and the blue line goes from 0 to 5 (with an arrow to the left, but since \(x\geq0\), it's from 0 to 5 with a closed circle at 5). So the correct graph is the third one (the one in the second row first column: closed circle at 5, line to the left, starting from 0).

Snap & solve any problem in the app
Get step-by-step solutions on Sovi AI
Photo-based solutions with guided steps
Explore more problems and detailed explanations
\(12x\leq60\)