QUESTION IMAGE
Question
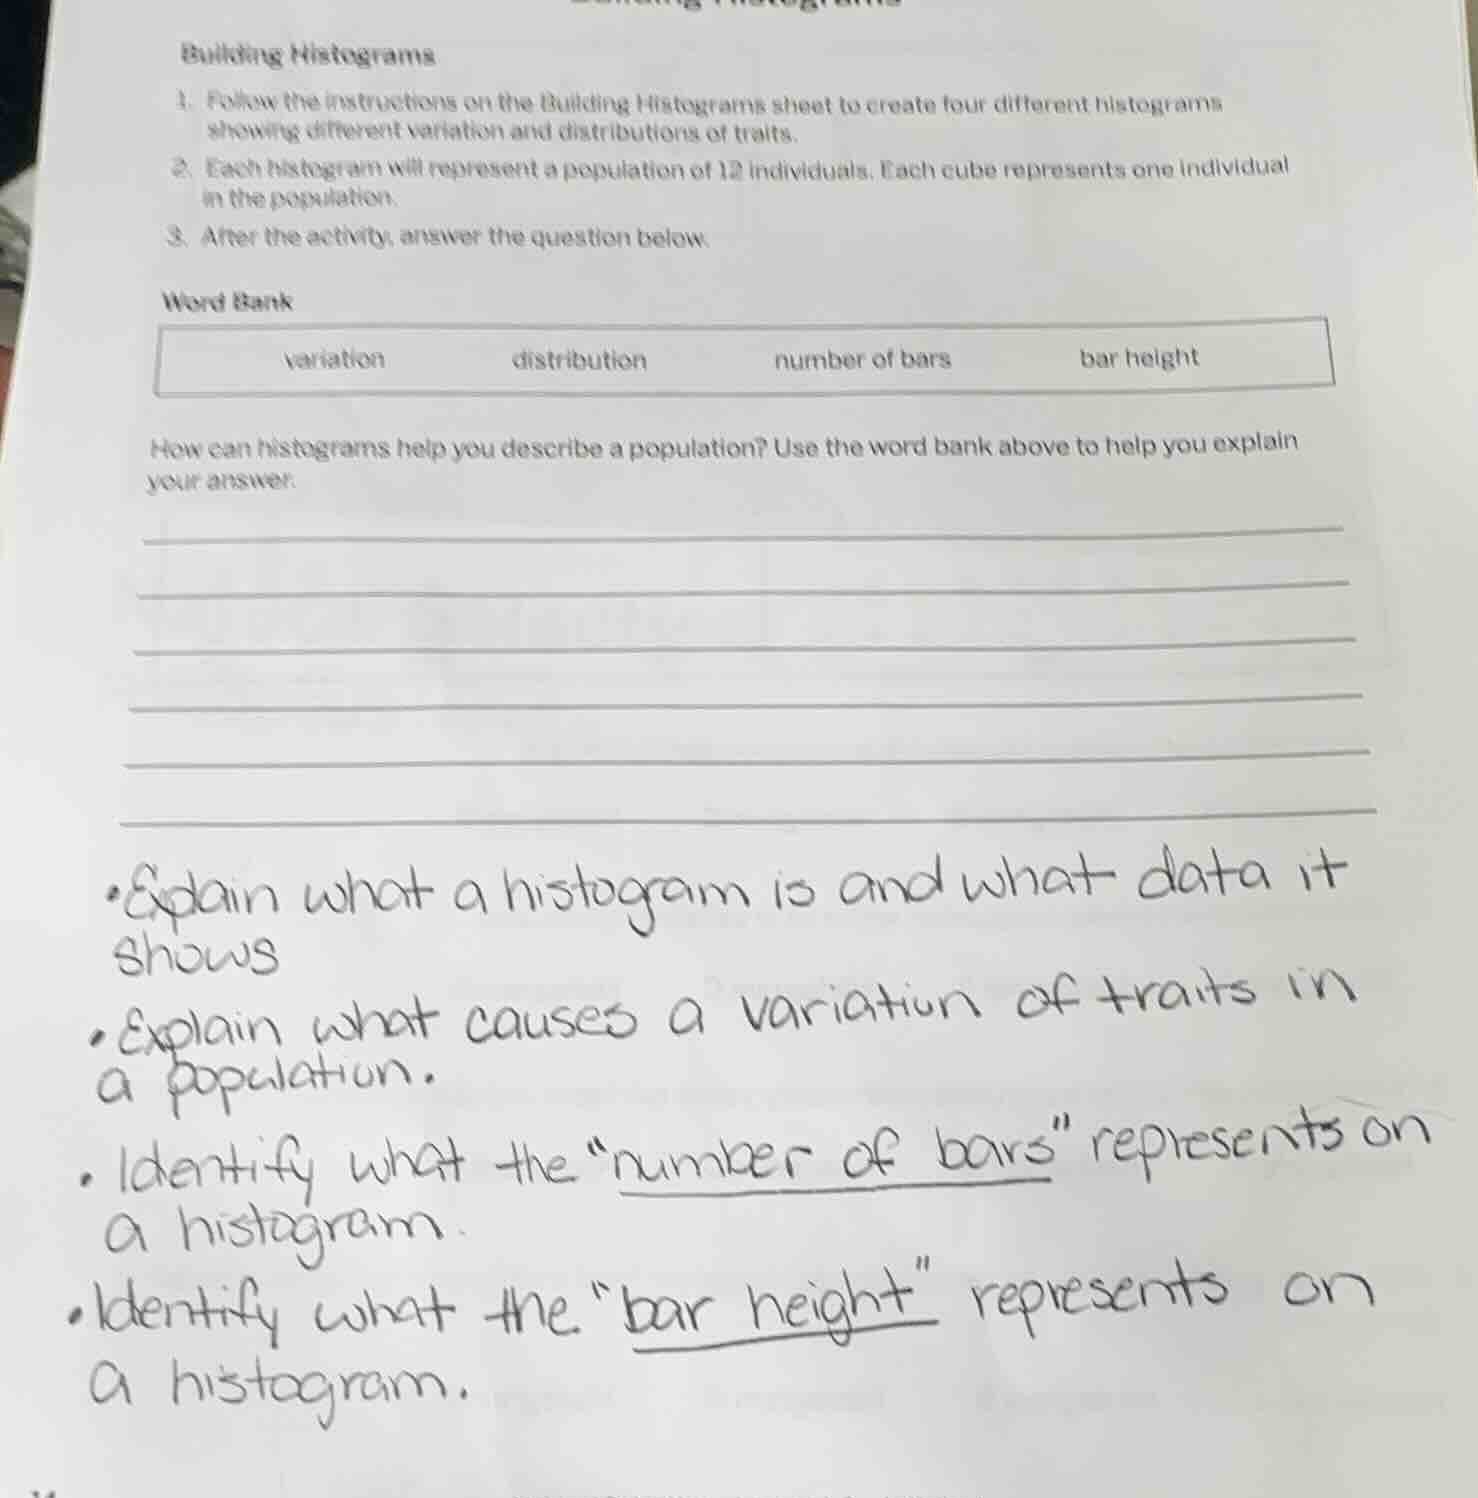
building histograms
- follow the instructions on the building histograms sheet to create four different histograms showing different variation and distributions of traits.
- each histogram will represent a population of 12 individuals. each cube represents one individual in the population.
- after the activity, answer the question below.
word bank
variation distribution number of bars bar height
how can histograms help you describe a population? use the word bank above to help you explain your answer.
- explain what a histogram is and what data it shows
- explain what causes a variation of traits in a population.
- identify what the
umber of bars\ represents on a histogram.
- identify what the \bar height\ represents on a histogram.

Snap & solve any problem in the app
Get step-by-step solutions on Sovi AI
Photo-based solutions with guided steps
Explore more problems and detailed explanations
Histograms help describe a population by showing the distribution of trait values via the number of bars, the variation in traits across groups, and bar height indicates the count of individuals in each trait group.
A histogram is a graphical display that organizes and shows the frequency distribution of continuous numerical data (or trait data for a population).
Variation of traits in a population is caused by genetic differences (mutations, genetic recombination), environmental factors, and the interaction between genes and the environment.
The "number of bars" represents the number of distinct trait categories or intervals into which the population's trait data is grouped.
The "bar height" represents the number (frequency) of individuals in the population that fall into the corresponding trait category or interval.