QUESTION IMAGE
Question
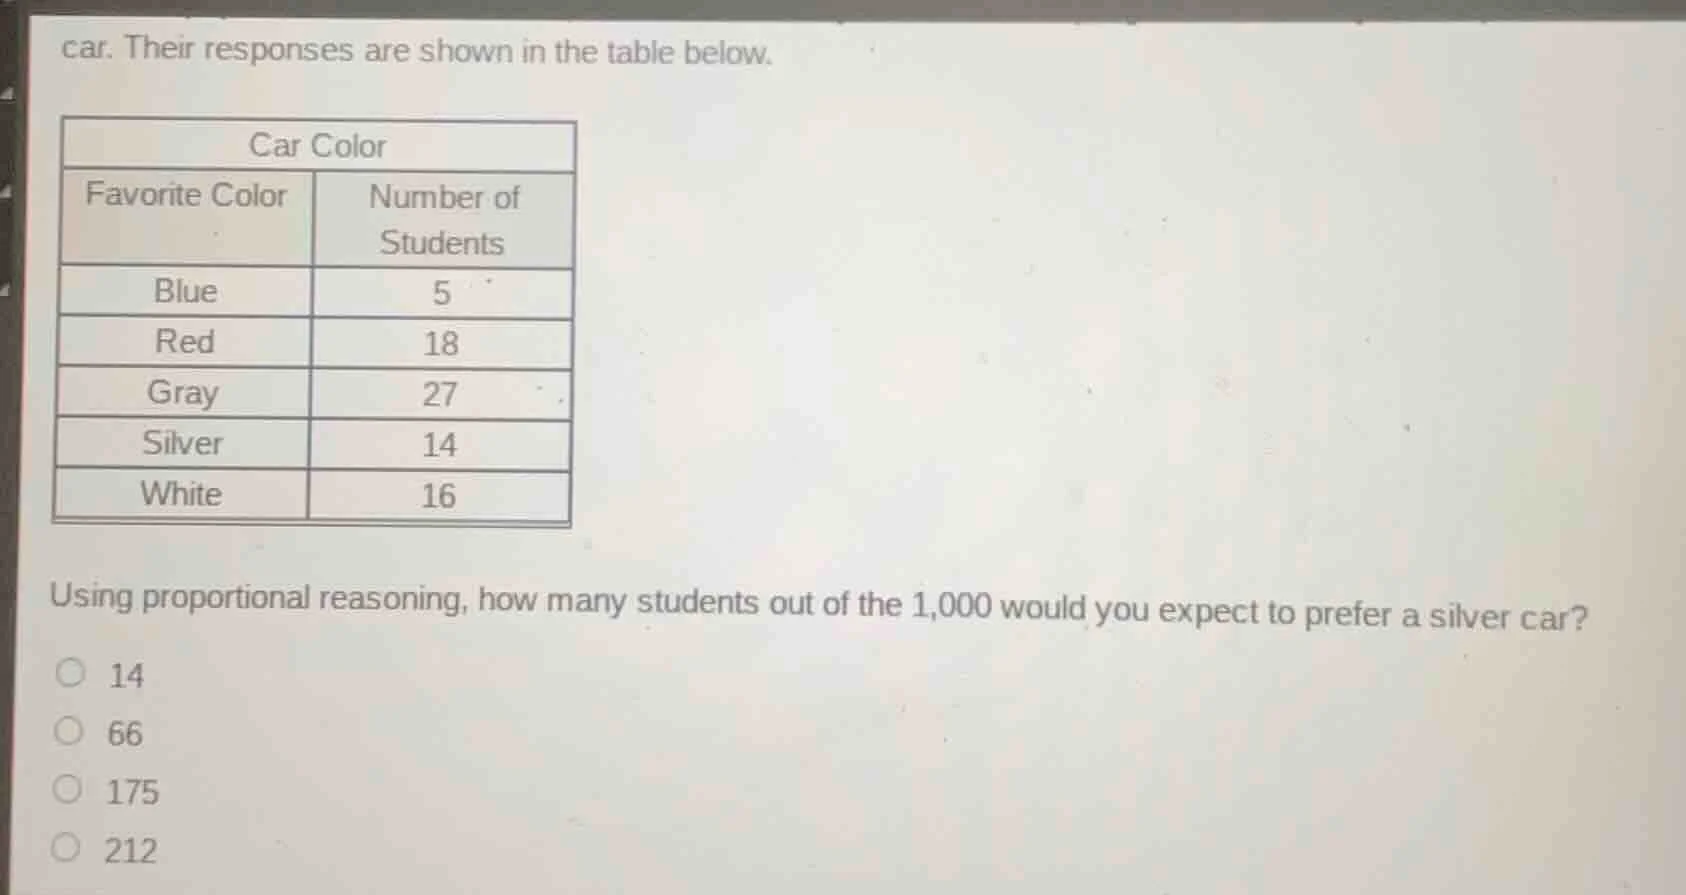
car. their responses are shown in the table below.
| car color | |
|---|---|
| blue | 5 |
| red | 18 |
| gray | 27 |
| silver | 14 |
| white | 16 |
using proportional reasoning, how many students out of the 1,000 would you expect to prefer a silver car?
○ 14
○ 66
○ 175
○ 212
Step1: Calculate total surveyed students
$5 + 18 + 27 + 14 + 16 = 80$
Step2: Find silver preference proportion
$\frac{14}{80} = 0.175$
Step3: Scale to 1000 students
$1000 \times 0.175 = 175$

Snap & solve any problem in the app
Get step-by-step solutions on Sovi AI
Photo-based solutions with guided steps
Explore more problems and detailed explanations
175 (Option C)