QUESTION IMAGE
Question
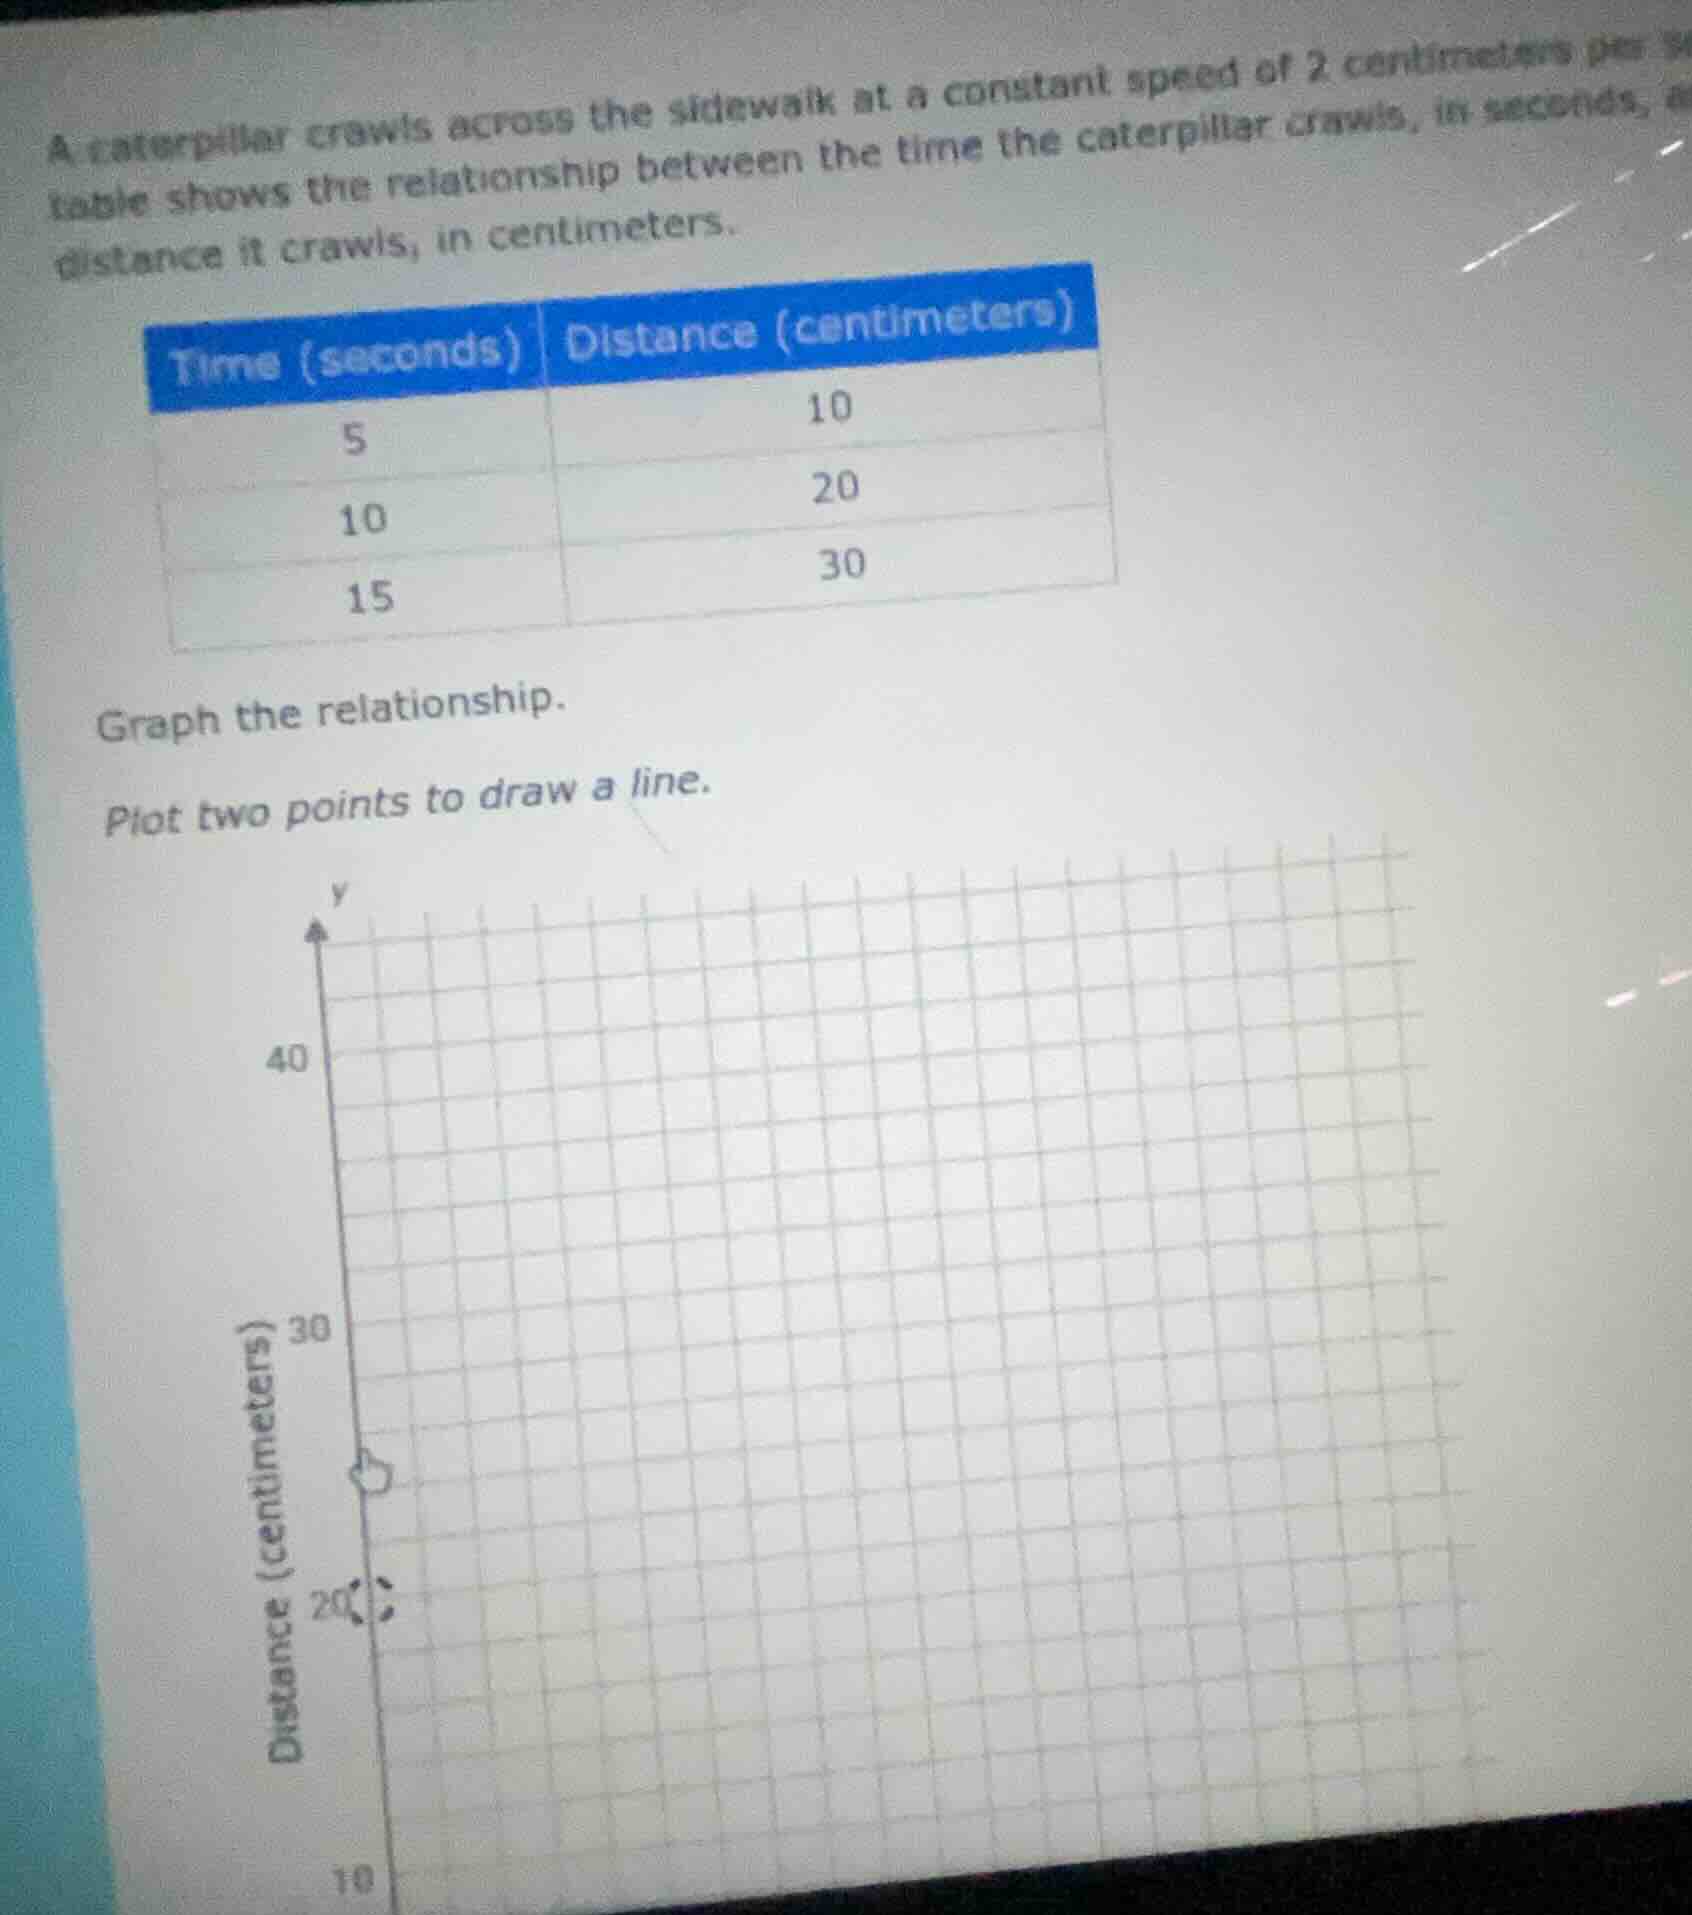
a caterpillar crawls across the sidewalk at a constant speed of 2 centimeters per... table shows the relationship between the time the caterpillar crawls, in seconds, and distance it crawls, in centimeters. time (seconds) | distance (centimeters) 5 | 10 10 | 20 15 | 30 graph the relationship. plot two points to draw a line.
Step1: Identify coordinate pairs
Each pair is (Time, Distance): $(5,10)$, $(10,20)$, $(15,30)$
Step2: Plot first point
Locate $x=5$ (time) on horizontal axis, $y=10$ (distance) on vertical axis, mark the point.
Step3: Plot second point
Locate $x=15$ (time) on horizontal axis, $y=30$ (distance) on vertical axis, mark the point.
Step4: Draw the line
Connect the two plotted points, extending through the origin $(0,0)$ (since distance is 0 at 0 time) and along the trend of the data.

Snap & solve any problem in the app
Get step-by-step solutions on Sovi AI
Photo-based solutions with guided steps
Explore more problems and detailed explanations
- Plot the points $(5, 10)$ and $(15, 30)$ on the provided grid (with the horizontal axis as Time in seconds, vertical axis as Distance in centimeters).
- Draw a straight line passing through these two points and the origin $(0,0)$ to represent the constant speed relationship.