QUESTION IMAGE
Question
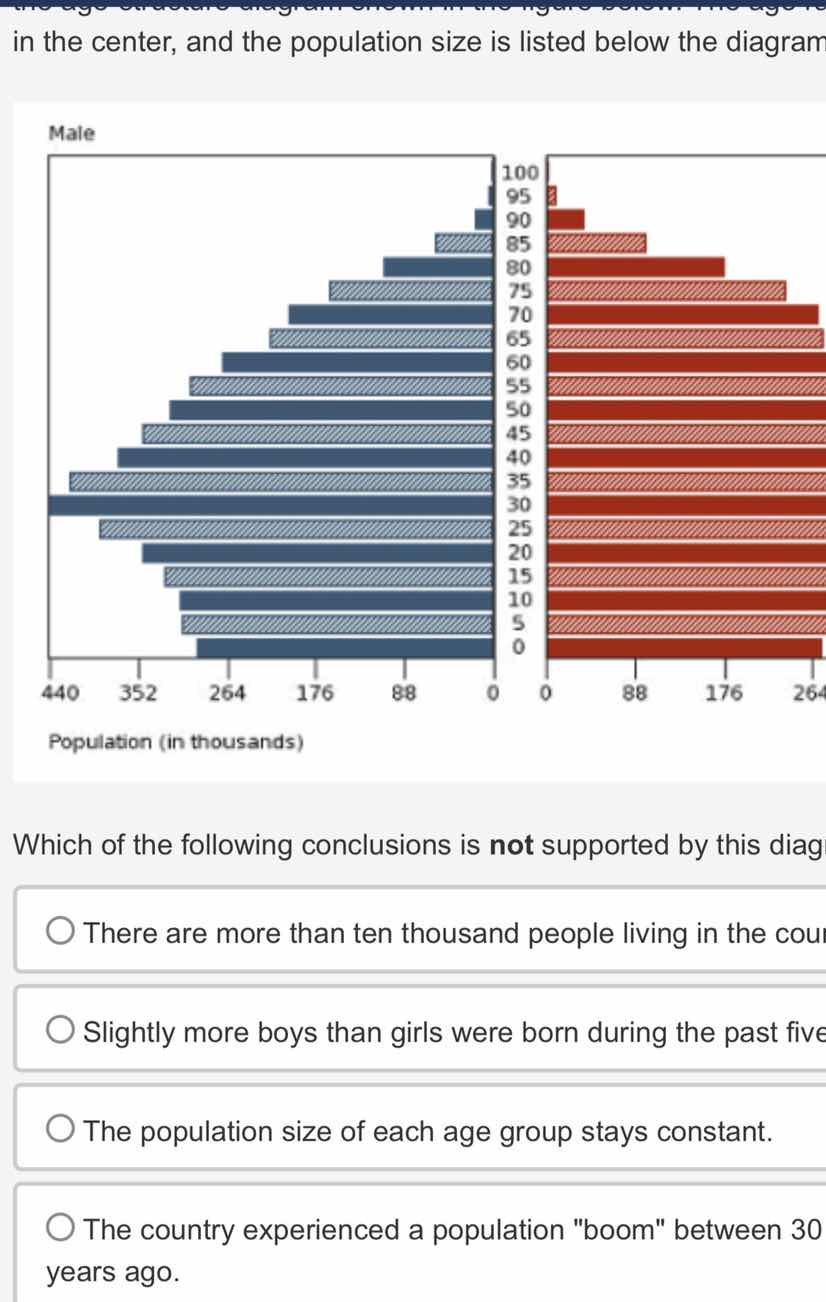
in the center, and the population size is listed below the diagram
male
which of the following conclusions is not supported by this diag
there are more than ten thousand people living in the cou
slightly more boys than girls were born during the past five
the population size of each age group stays constant.
the country experienced a population \boom\ between 30
years ago.
Brief Explanations
- For the first option, the population (in thousands) across age groups sums to a large number, so "more than ten thousand" is supported.
- For the second option, the 0 - 5 age group (past five years) for males (blue) is slightly longer than females (red), so this is supported.
- For the third option, the lengths of the bars (population sizes) for different age groups vary (e.g., 30 - 35 age group has a larger population than 0 - 5 or older groups), so the population size of each age group does not stay constant. This conclusion is not supported.
- For the fourth option, the 30 - 35 (and surrounding) age groups have larger population bars, indicating a population boom around 30 years ago (since those people would be 30 - 35 now), so this is supported.

Snap & solve any problem in the app
Get step-by-step solutions on Sovi AI
Photo-based solutions with guided steps
Explore more problems and detailed explanations
The conclusion not supported by the diagram is: The population size of each age group stays constant.