QUESTION IMAGE
Question
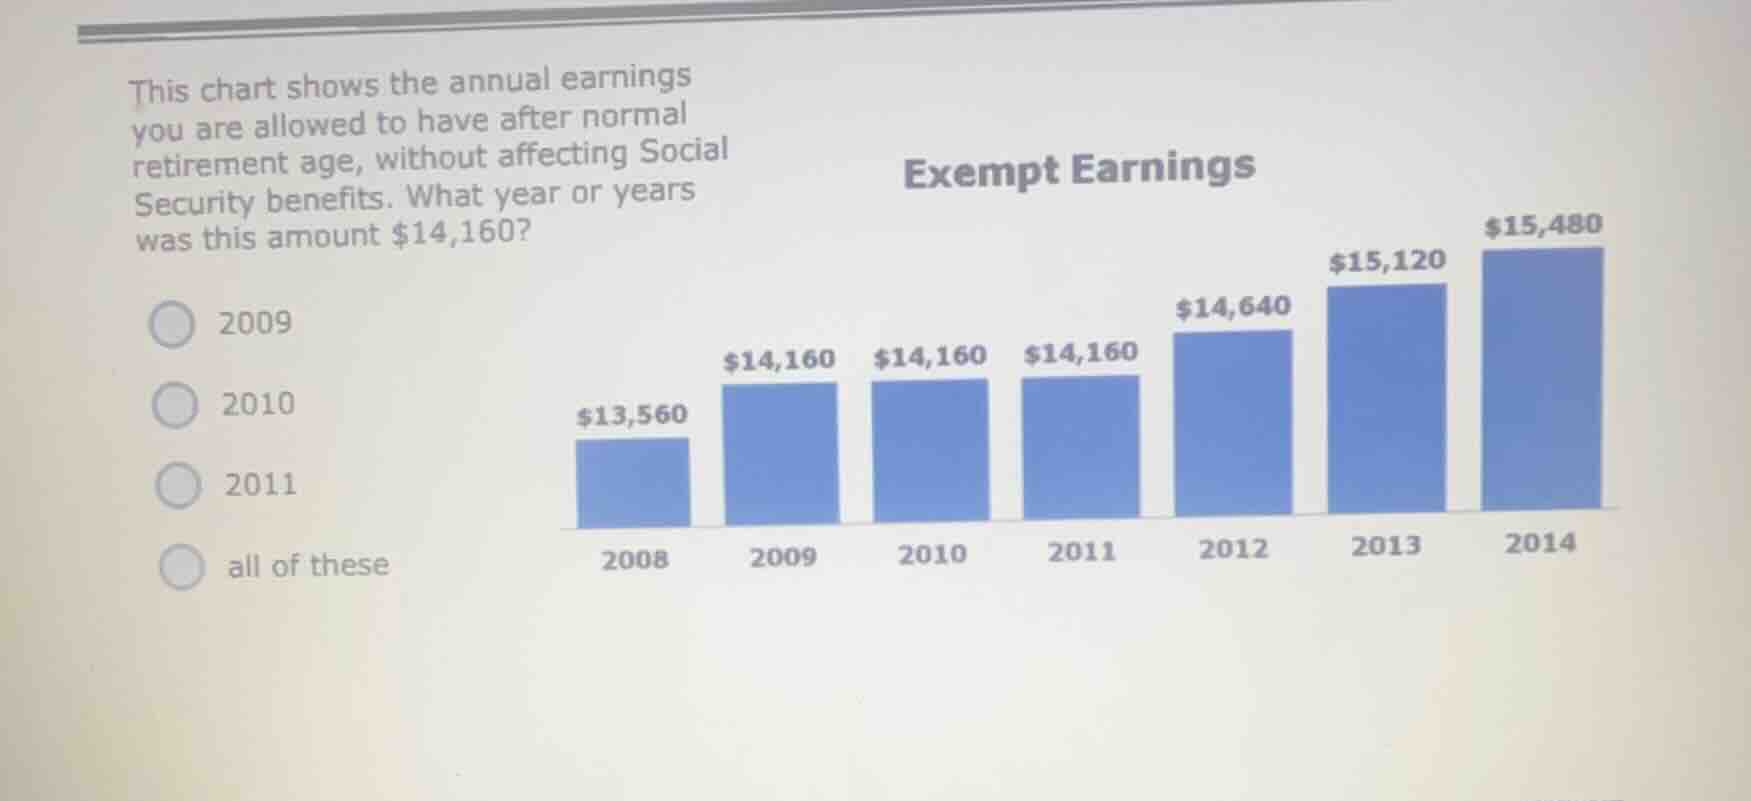
this chart shows the annual earnings you are allowed to have after normal retirement age, without affecting social security benefits. what year or years was this amount $14,160? 2009 2010 2011 all of these exempt earnings $13,560 $14,160 $14,160 $14,160 $14,640 $15,120 $15,480 2008 2009 2010 2011 2012 2013 2014
Looking at the bar graph titled "Exempt Earnings", we can see the annual earnings for each year. For 2009, 2010, and 2011, the exempt earnings amount is $14,160. So we check the options: 2009, 2010, 2011 each have $14,160, so "all of these" is correct.

Snap & solve any problem in the app
Get step-by-step solutions on Sovi AI
Photo-based solutions with guided steps
Explore more problems and detailed explanations
D. all of these (assuming the options are labeled A. 2009, B. 2010, C. 2011, D. all of these)