QUESTION IMAGE
Question
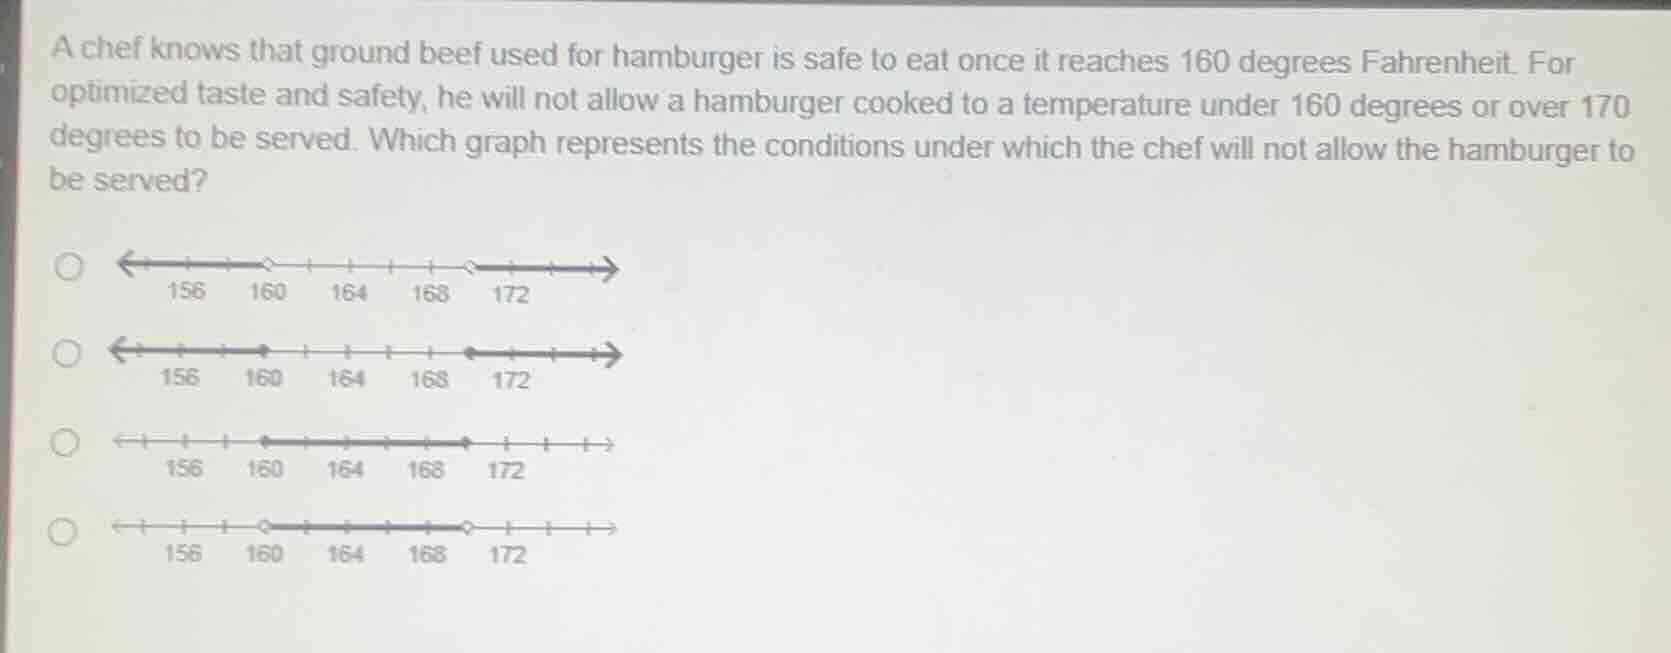
a chef knows that ground beef used for hamburger is safe to eat once it reaches 160 degrees fahrenheit. for optimized taste and safety, he will not allow a hamburger cooked to a temperature under 160 degrees or over 170 degrees to be served. which graph represents the conditions under which the chef will not allow the hamburger to be served? 156 160 164 168 172 156 160 164 168 172 156 160 164 168 172 156 160 164 168 172
Step1: Define forbidden temperatures
Let $T$ = hamburger temperature. Forbidden: $T < 160$ or $T > 170$.
Step2: Match to number line rules
Open circles for $<$/$>$ (exclude 160, 170); shade left of 160, right of 170.
Step3: Identify correct graph
First graph has open circles at 160,172 (170 equivalent here), shaded outside.

Snap & solve any problem in the app
Get step-by-step solutions on Sovi AI
Photo-based solutions with guided steps
Explore more problems and detailed explanations
The first option: $\boldsymbol{\longleftarrow\hspace{1em}\text{---}\hspace{0.2em}\circ\hspace{0.2em}\text{----}\hspace{0.2em}\circ\hspace{0.2em}\text{---}\hspace{1em}\longrightarrow}$ (with open circles at 160 and 172, shading to the left of 160 and right of 172)