QUESTION IMAGE
Question
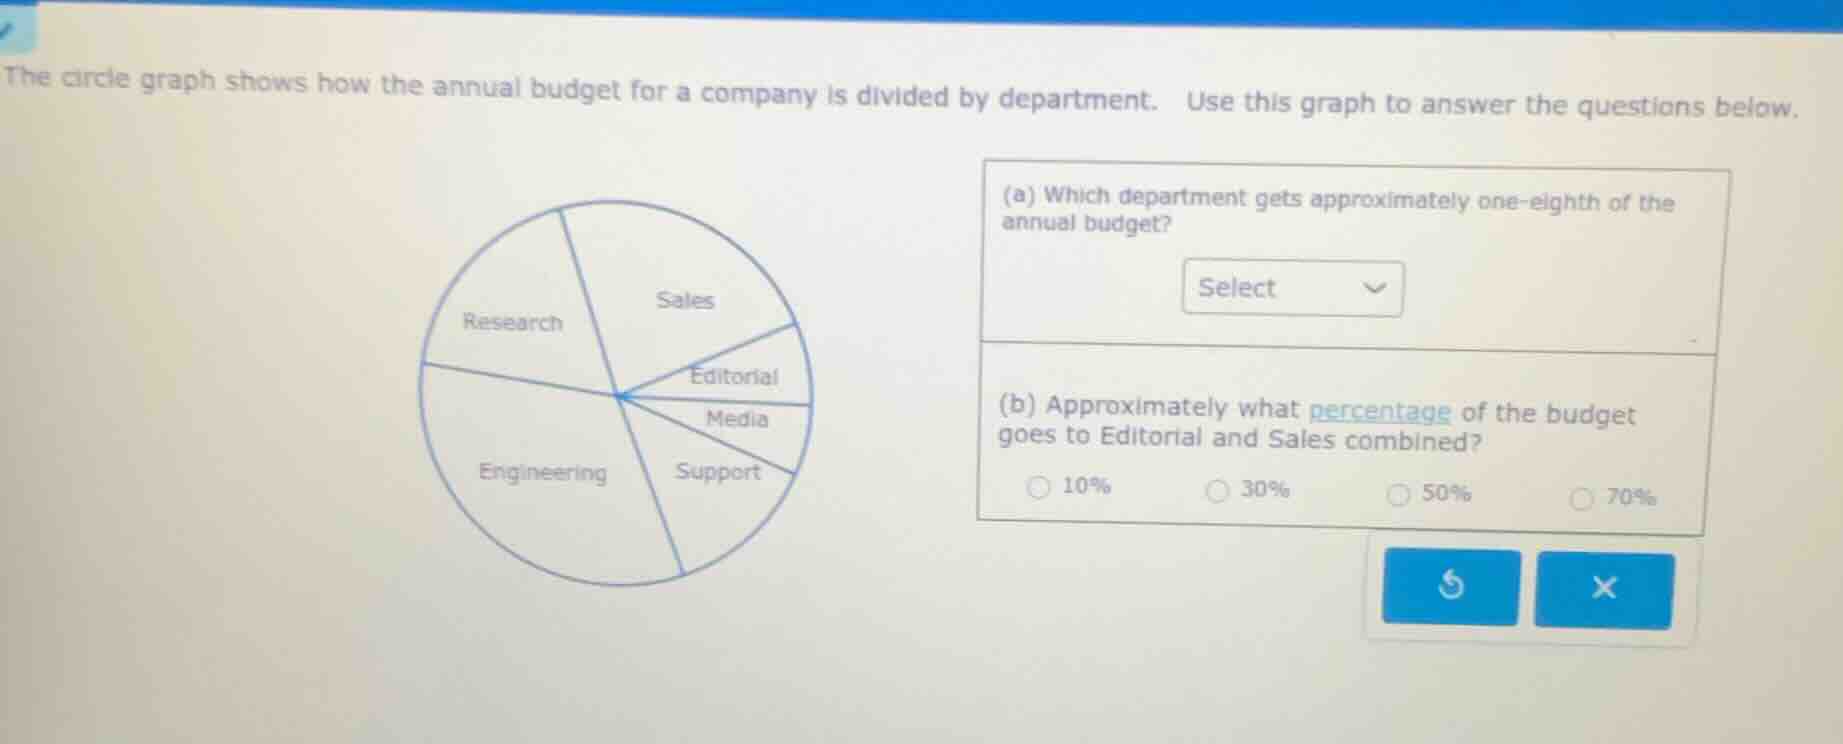
the circle graph shows how the annual budget for a company is divided by department. use this graph to answer the questions below.
(a) which department gets approximately one - eighth of the annual budget?
select
(b) approximately what percentage of the budget goes to editorial and sales combined?
10% 30% 50% 70%
Step1: Convert 1/8 to percentage
One-eighth as a percentage is $\frac{1}{8} \times 100\% = 12.5\%$. A full circle is 360 degrees, so 12.5% of 360 is $0.125 \times 360 = 45$ degrees. Observing the pie chart, the Research slice is closest to this size.
Step2: Estimate combined percentage
First, estimate each department's share: Sales is ~20%, Editorial is ~10%. Add these shares: $20\% + 10\% = 30\%$. This matches the 30% option.

Snap & solve any problem in the app
Get step-by-step solutions on Sovi AI
Photo-based solutions with guided steps
Explore more problems and detailed explanations
(a) Research
(b) 30%