QUESTION IMAGE
Question
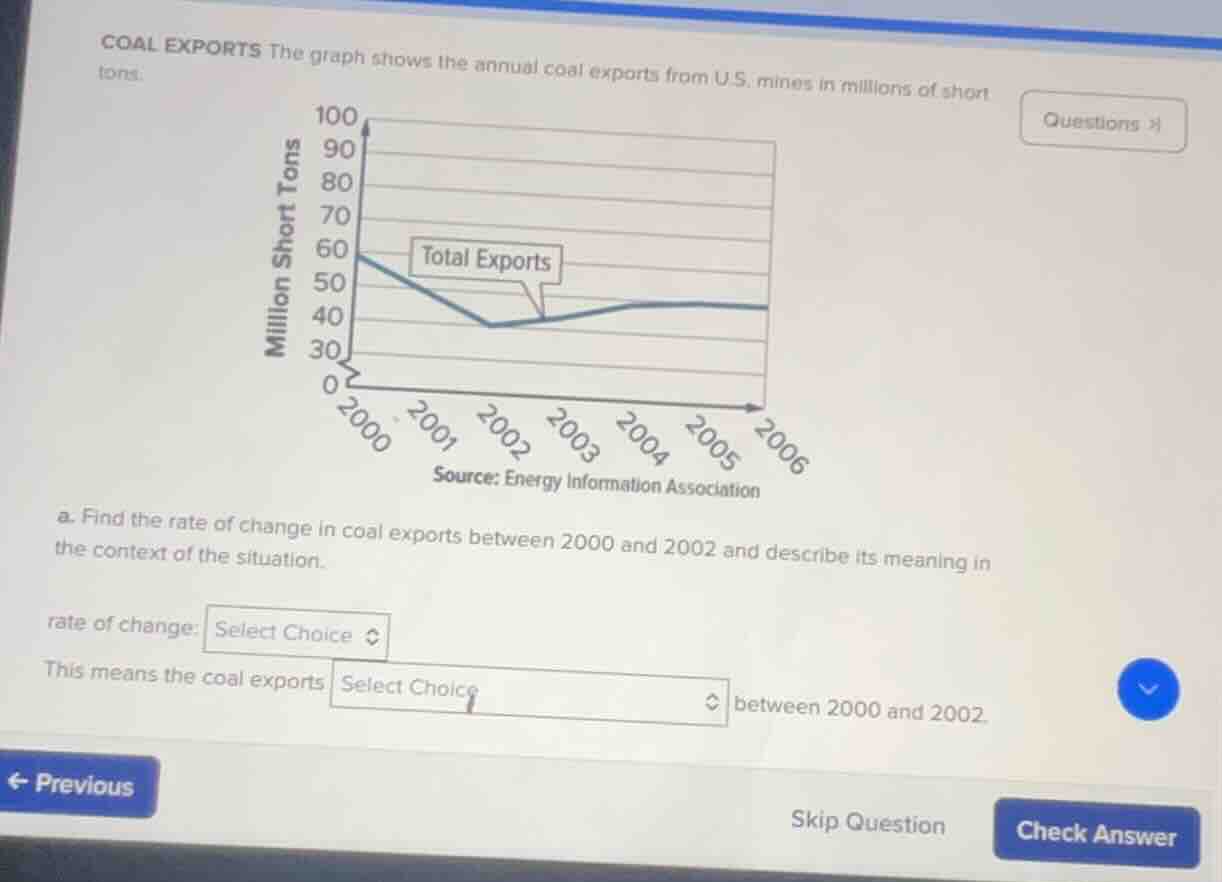
coal exports the graph shows the annual coal exports from u.s. mines in millions of short tons. a. find the rate of change in coal exports between 2000 and 2002 and describe its meaning in the context of the situation. rate of change: select choice this means the coal exports select choice between 2000 and 2002.
Step1: Identify data points
In 2000, exports (let \( y_1 \)) = 60 million short tons. In 2002, exports (let \( y_2 \)) = 40 million short tons. Time difference (\( x_2 - x_1 \)) = 2002 - 2000 = 2 years.
Step2: Calculate rate of change
Rate of change formula: \( \frac{y_2 - y_1}{x_2 - x_1} \)
Substitute values: \( \frac{40 - 60}{2002 - 2000} = \frac{-20}{2} = -10 \)
Step3: Interpret the rate
A negative rate means exports decreased. The rate of -10 means coal exports decreased by 10 million short tons per year between 2000 and 2002.

Snap & solve any problem in the app
Get step-by-step solutions on Sovi AI
Photo-based solutions with guided steps
Explore more problems and detailed explanations
rate of change: \(-10\)
This means the coal exports decreased by 10 million short tons per year between 2000 and 2002.