QUESTION IMAGE
Question
color | people\
blue | 10,000\
green | 5,000\
orange | 3,000\
yellow | 7,000\
red | 2,000
Step1: Analyze the data from the table
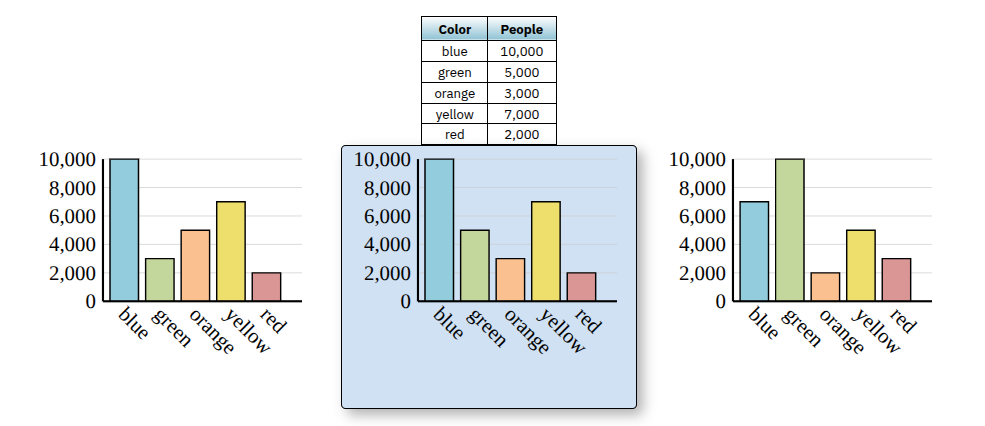
The table gives the number of people for each color: blue (10,000), green (5,000), orange (3,000), yellow (7,000), red (2,000).
Step2: Compare with each bar graph
- First graph: green bar height seems less than 5,000, orange bar height seems more than 3,000, so not matching.
- Second graph: blue (10,000), green (5,000), orange (3,000), yellow (7,000), red (2,000) – matches the table data.
- Third graph: green bar height is more than 10,000, blue is less than 10,000, so not matching.

Snap & solve any problem in the app
Get step-by-step solutions on Sovi AI
Photo-based solutions with guided steps
Explore more problems and detailed explanations
The middle bar graph (the one with the blue background) correctly represents the data from the table.