QUESTION IMAGE
Question
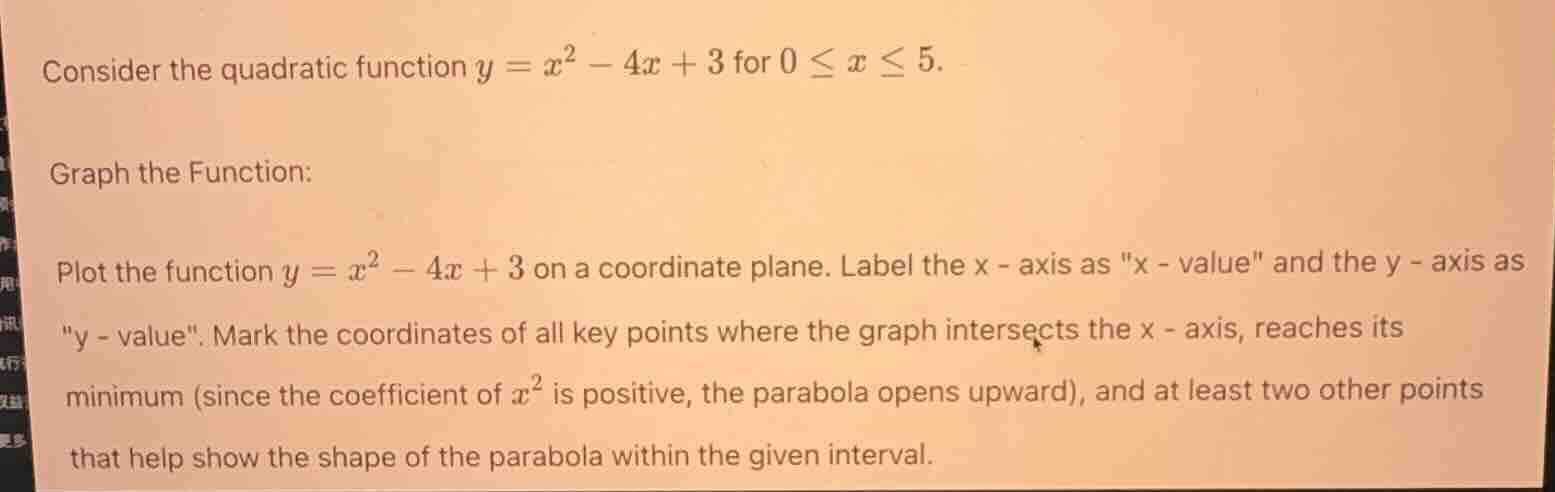
consider the quadratic function $y = x^2 - 4x + 3$ for $0 \leq x \leq 5$.
graph the function:
plot the function $y = x^2 - 4x + 3$ on a coordinate plane. label the x - axis as \x - value\ and the y - axis as \y - value\. mark the coordinates of all key points where the graph intersects the x - axis, reaches its minimum (since the coefficient of $x^2$ is positive, the parabola opens upward), and at least two other points that help show the shape of the parabola within the given interval.
Step1: Find x-intercepts (y=0)
Set \( y = 0 \), solve \( x^2 - 4x + 3 = 0 \). Factor: \( (x - 1)(x - 3) = 0 \). So \( x = 1 \) or \( x = 3 \). Intercepts: \( (1, 0) \), \( (3, 0) \).
Step2: Find vertex (minimum point)
For \( y = ax^2 + bx + c \), vertex x-coordinate: \( x = -\frac{b}{2a} \). Here, \( a = 1 \), \( b = -4 \), so \( x = -\frac{-4}{2(1)} = 2 \). Substitute \( x = 2 \) into \( y \): \( y = 2^2 - 4(2) + 3 = -1 \). Vertex: \( (2, -1) \).
Step3: Find other points
Choose \( x = 0 \): \( y = 0^2 - 4(0) + 3 = 3 \). Point: \( (0, 3) \).
Choose \( x = 5 \): \( y = 5^2 - 4(5) + 3 = 8 \). Point: \( (5, 8) \).
Step4: Graphing
- Draw coordinate plane, label x-axis "x - value", y-axis "y - value".
- Plot \( (1, 0) \), \( (3, 0) \), \( (2, -1) \), \( (0, 3) \), \( (5, 8) \).
- Draw parabola through these points (opening upward, since \( a > 0 \)).

Snap & solve any problem in the app
Get step-by-step solutions on Sovi AI
Photo-based solutions with guided steps
Explore more problems and detailed explanations
The graph is a parabola opening upward with x - intercepts at \( (1, 0) \) and \( (3, 0) \), vertex at \( (2, -1) \), and additional points \( (0, 3) \) and \( (5, 8) \) plotted, with axes labeled "x - value" (x - axis) and "y - value" (y - axis).