QUESTION IMAGE
Question
on core algebra i b-cr
englis
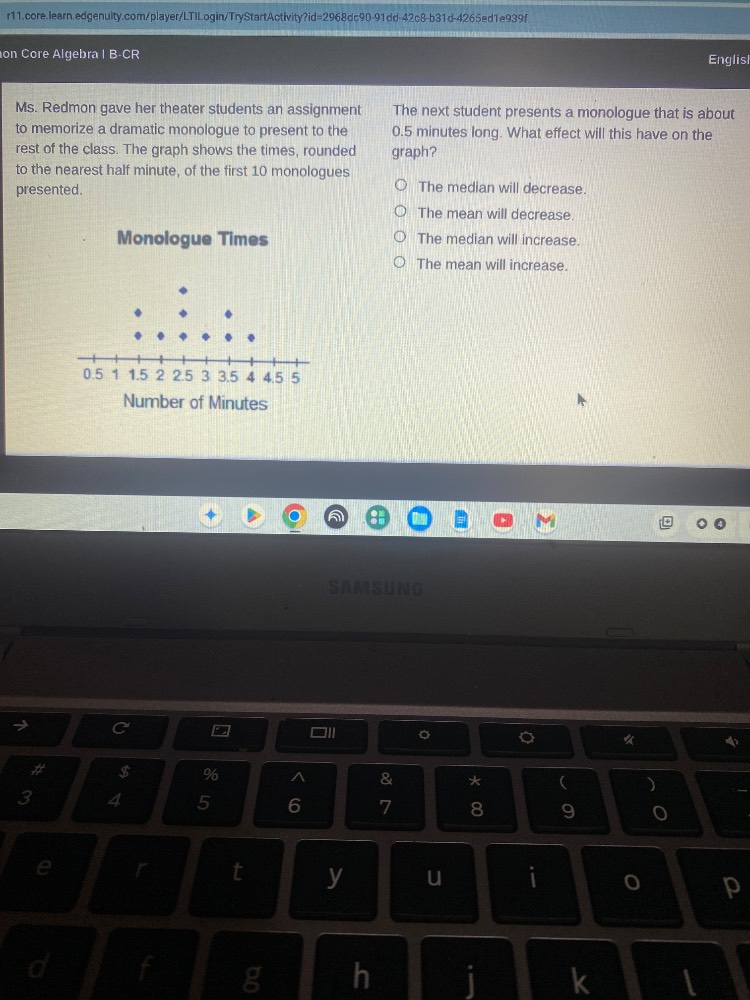
ms. redmon gave her theater students an assignment to memorize a dramatic monologue to present to the rest of the class. the graph shows the times, rounded to the nearest half minute, of the first 10 monologues presented.
monologue times
number of minutes
the next student presents a monologue that is about 0.5 minutes long. what effect will this have on the graph?
○ the median will decrease.
○ the mean will decrease.
○ the median will increase.
○ the mean will increase.
Step1: List original 10 data points
From the dot plot, the times are: 1, 1.5, 1.5, 2, 2, 2.5, 3, 3, 3.5, 3.5
Step2: Calculate original mean
$\text{Mean} = \frac{1+1.5+1.5+2+2+2.5+3+3+3.5+3.5}{10} = \frac{23}{10} = 2.3$
Step3: Calculate original median
For 10 values, median is average of 5th and 6th terms: $\frac{2+2.5}{2} = 2.25$
Step4: Add new data point (0.5), get 11 values
New data set: 0.5, 1, 1.5, 1.5, 2, 2, 2.5, 3, 3, 3.5, 3.5
Step5: Calculate new mean
$\text{New Mean} = \frac{23 + 0.5}{11} = \frac{23.5}{11} \approx 2.14$
Step6: Calculate new median
For 11 values, median is the 6th term: $2$
Step7: Compare changes
Mean decreases from 2.3 to ~2.14; median decreases from 2.25 to 2.

Snap & solve any problem in the app
Get step-by-step solutions on Sovi AI
Photo-based solutions with guided steps
Explore more problems and detailed explanations
The median will decrease.
The mean will decrease.