QUESTION IMAGE
Question
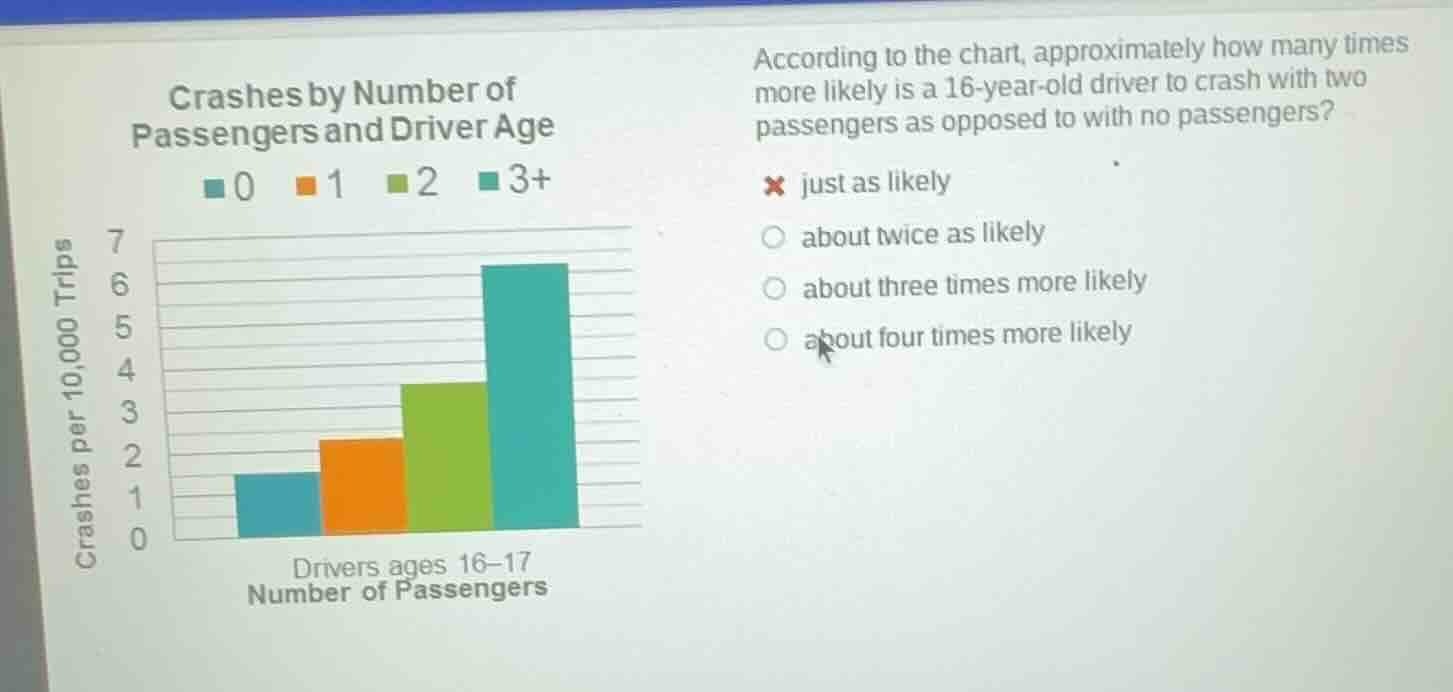
crashes by number of passengers and driver age
0 1 2 3+
drivers ages 16–17
number of passengers
crashes per 10,000 trips
according to the chart, approximately how many times more likely is a 16-year-old driver to crash with two passengers as opposed to with no passengers?
× just as likely
○ about twice as likely
○ about three times more likely
○ about four times more likely
Step1: Identify the values from the chart
For 0 passengers (blue bar), the crashes per 10,000 trips is approximately 1.5. For 2 passengers (green bar), the crashes per 10,000 trips is approximately 3.5. Wait, no, looking again, the blue bar (0 passengers) is around 1.5? Wait, no, the y - axis: the blue bar (0 passengers) reaches up to about 1.5? Wait, no, the green bar (2 passengers) is around 3.5? Wait, no, let's re - examine. The blue bar (0 passengers) is at about 1.5? Wait, no, the correct way: the blue bar (0 passengers) is approximately 1.5? Wait, no, the green bar (2 passengers) is around 3.5? Wait, no, actually, the blue bar (0 passengers) is about 1.5, and the green bar (2 passengers) is about 3.5? Wait, no, maybe I misread. Wait, the blue bar (0 passengers) is at about 1.5, the green bar (2 passengers) is at about 3.5? Wait, no, let's do it properly. Let's look at the y - axis: the scale is 0 - 7, with each line representing 0.5? Wait, no, the blue bar (0 passengers) is at about 1.5, the green bar (2 passengers) is at about 3.5? Wait, no, actually, the blue bar (0 passengers) is approximately 1.5, and the green bar (2 passengers) is approximately 3.5? Wait, no, maybe the blue bar (0 passengers) is 1.5, and the green bar (2 passengers) is 3.5. Then the ratio is 3.5 / 1.5≈2.33, which is about twice. Wait, no, maybe I made a mistake. Wait, the blue bar (0 passengers) is at about 1.5, the green bar (2 passengers) is at about 3. So 3 / 1.5 = 2. So it's about twice as likely. Wait, no, let's check again. The blue bar (0 passengers) is around 1.5, the green bar (2 passengers) is around 3. So 3 divided by 1.5 is 2. So the 16 - year - old driver with 2 passengers has about twice the number of crashes per 10,000 trips as with 0 passengers.
Step2: Calculate the ratio
The number of crashes per 10,000 trips for 0 passengers (\(C_0\)) is approximately 1.5, and for 2 passengers (\(C_2\)) is approximately 3. The ratio \(r=\frac{C_2}{C_0}=\frac{3}{1.5} = 2\). So it's about twice as likely.

Snap & solve any problem in the app
Get step-by-step solutions on Sovi AI
Photo-based solutions with guided steps
Explore more problems and detailed explanations
about twice as likely (the option: about twice as likely)