QUESTION IMAGE
Question
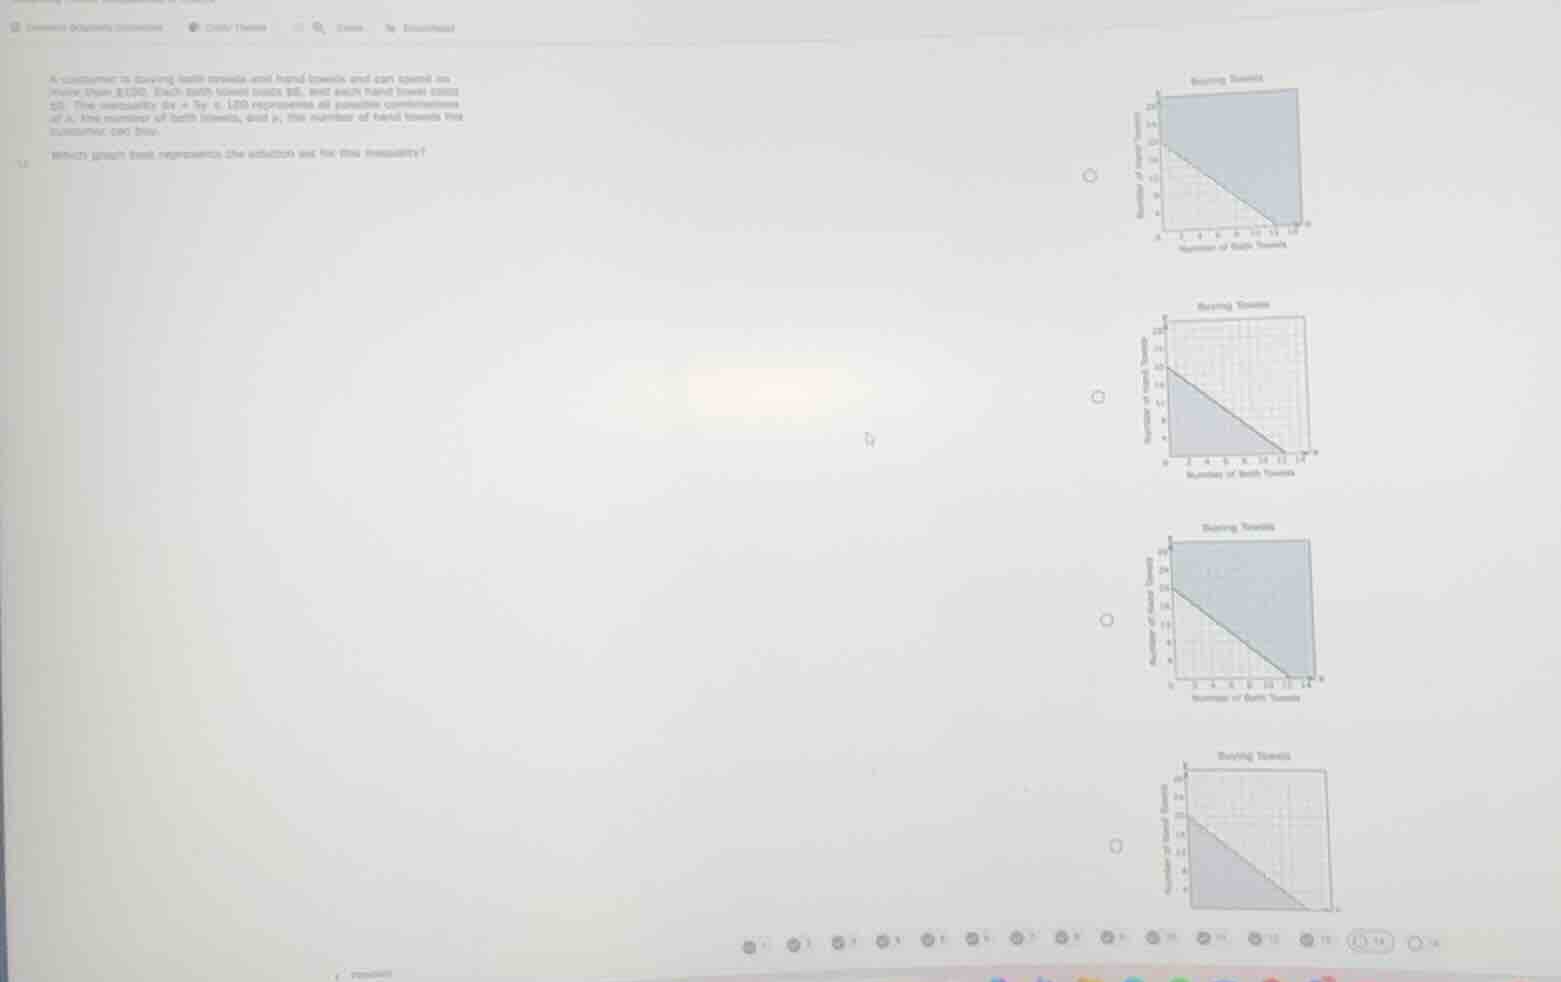
a customer is buying bath towels and hand towels and can spend no more than $120. each bath towel costs $8, and each hand towel costs $5. the inequality ( 8x + 5y leq 120 ) represents all possible combinations of ( x ), the number of bath towels, and ( y ), the number of hand towels the customer can buy.
which graph best represents the solution set for this inequality?
Step1: Define variables & budget inequality
Let $x$ = number of bath towels, $y$ = number of hand towels. Total cost: $8x + 5y \leq 120$.
Step2: Find intercepts for boundary
- $x$-intercept (y=0): $8x=120 \implies x=15$
- $y$-intercept (x=0): $5y=120 \implies y=24$
Step3: Identify valid solution region
The solution includes all non-negative $(x,y)$ (can't buy negative towels) where total cost is ≤120, so the region is above the axes, below/on the line $8x+5y=120$, and includes all points where spending is within budget (shaded area includes all affordable combinations, not just below the line with no upper y-limit beyond intercept).
Step4: Match to correct graph
The line connects (15,0) and (0,24). The valid shaded region is the area bounded by the x-axis, y-axis, and the line, including all points where $8x+5y \leq 120$ (top-left graph with the shaded area covering the budget-compliant region up to y=24 and x=15).

Snap & solve any problem in the app
Get step-by-step solutions on Sovi AI
Photo-based solutions with guided steps
Explore more problems and detailed explanations
The top-most graph (with the shaded region bounded by the line connecting (15, 0) and (0, 24), the x-axis, and y-axis, including the area above the line's lower side within the non-negative quadrant) is the correct solution set.