QUESTION IMAGE
Question
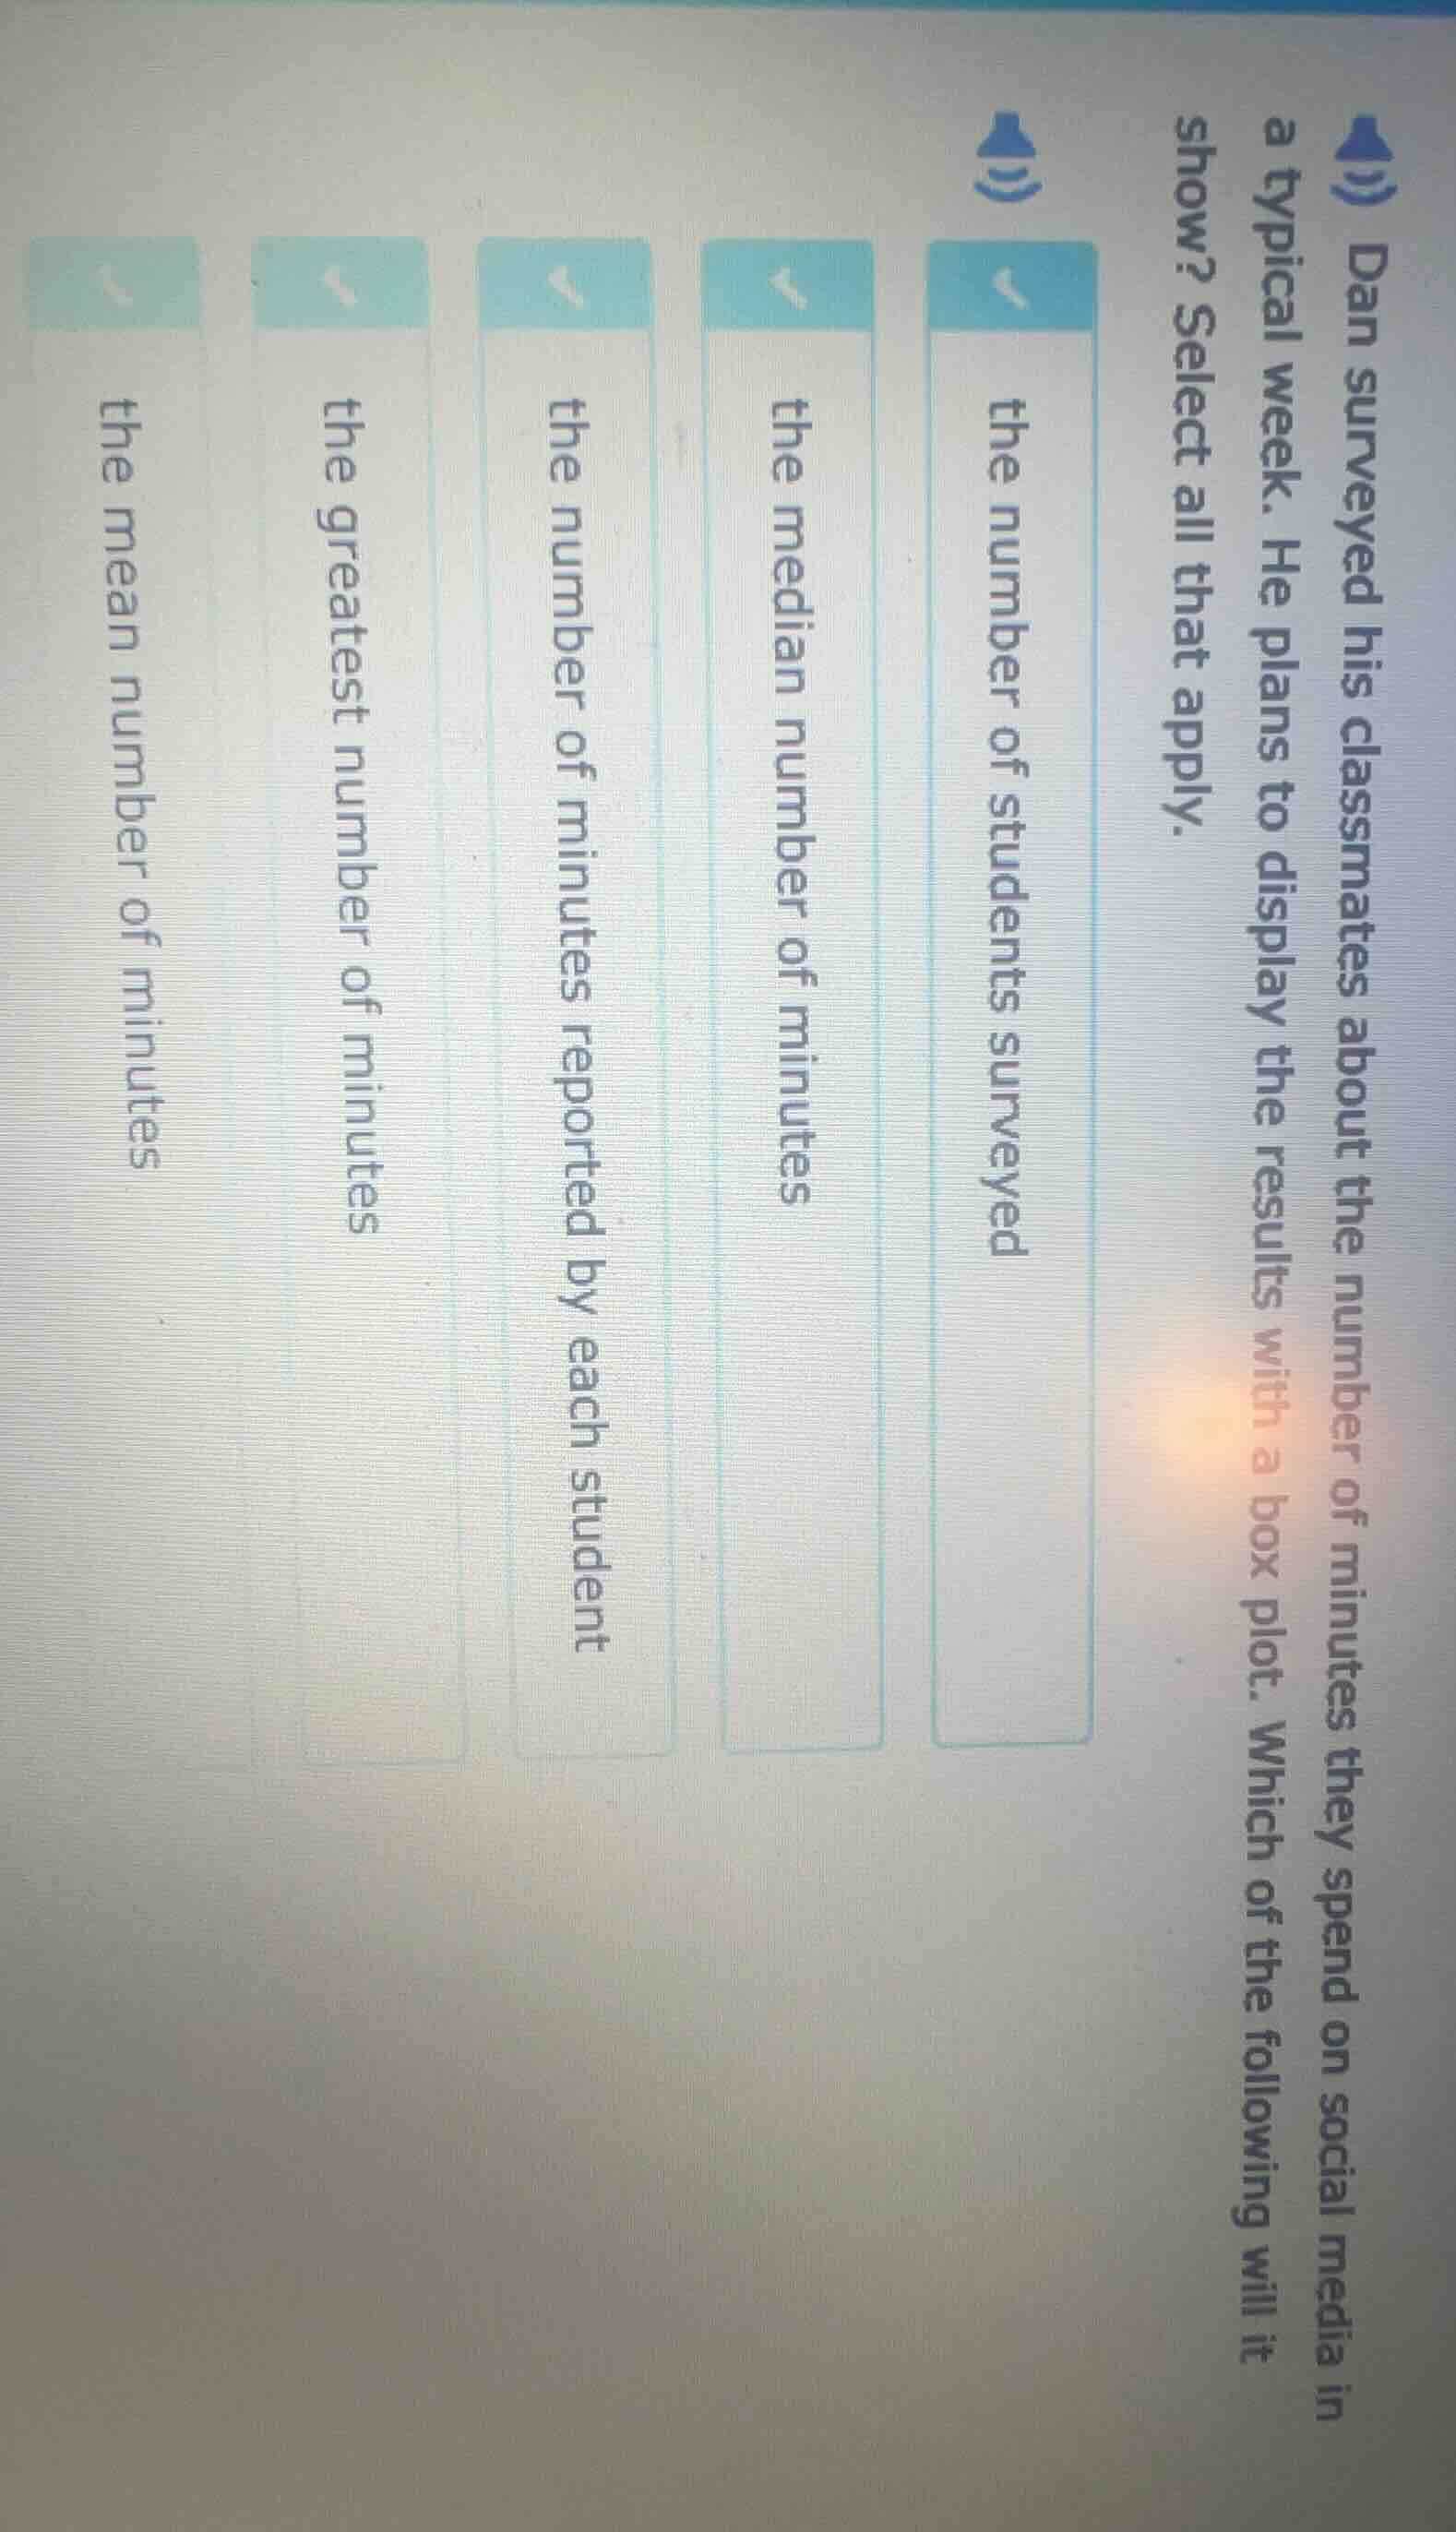
dan surveyed his classmates about the number of minutes they spend on social media in a typical week. he plans to display the results with a box plot. which of the following will it show? select all that apply. the number of students surveyed the median number of minutes the number of minutes reported by each student the greatest number of minutes the mean number of minutes
A box plot (box - and - whisker plot) is used to display the five - number summary of a data set. The five - number summary consists of the minimum value, the first quartile (\(Q_1\)), the median (second quartile, \(Q_2\)), the third quartile (\(Q_3\)), and the maximum value.
- The "the number of students surveyed" is not a measure related to the data values of the minutes spent on social media, so a box plot does not show this.
- The "the number of minutes reported by each student" is the raw data, and a box plot is a summary plot, not a plot that shows each individual data point.
- The "mean number of minutes" is not part of the five - number summary that a box plot displays.
- The "median number of minutes" is part of the five - number summary (it is the second quartile, \(Q_2\)) and is shown in a box plot.
- The "greatest number of minutes" (the maximum value) is part of the five - number summary and is shown in a box plot (as the end of the upper whisker or the upper adjacent value).

Snap & solve any problem in the app
Get step-by-step solutions on Sovi AI
Photo-based solutions with guided steps
Explore more problems and detailed explanations
the median number of minutes, the greatest number of minutes