QUESTION IMAGE
Question
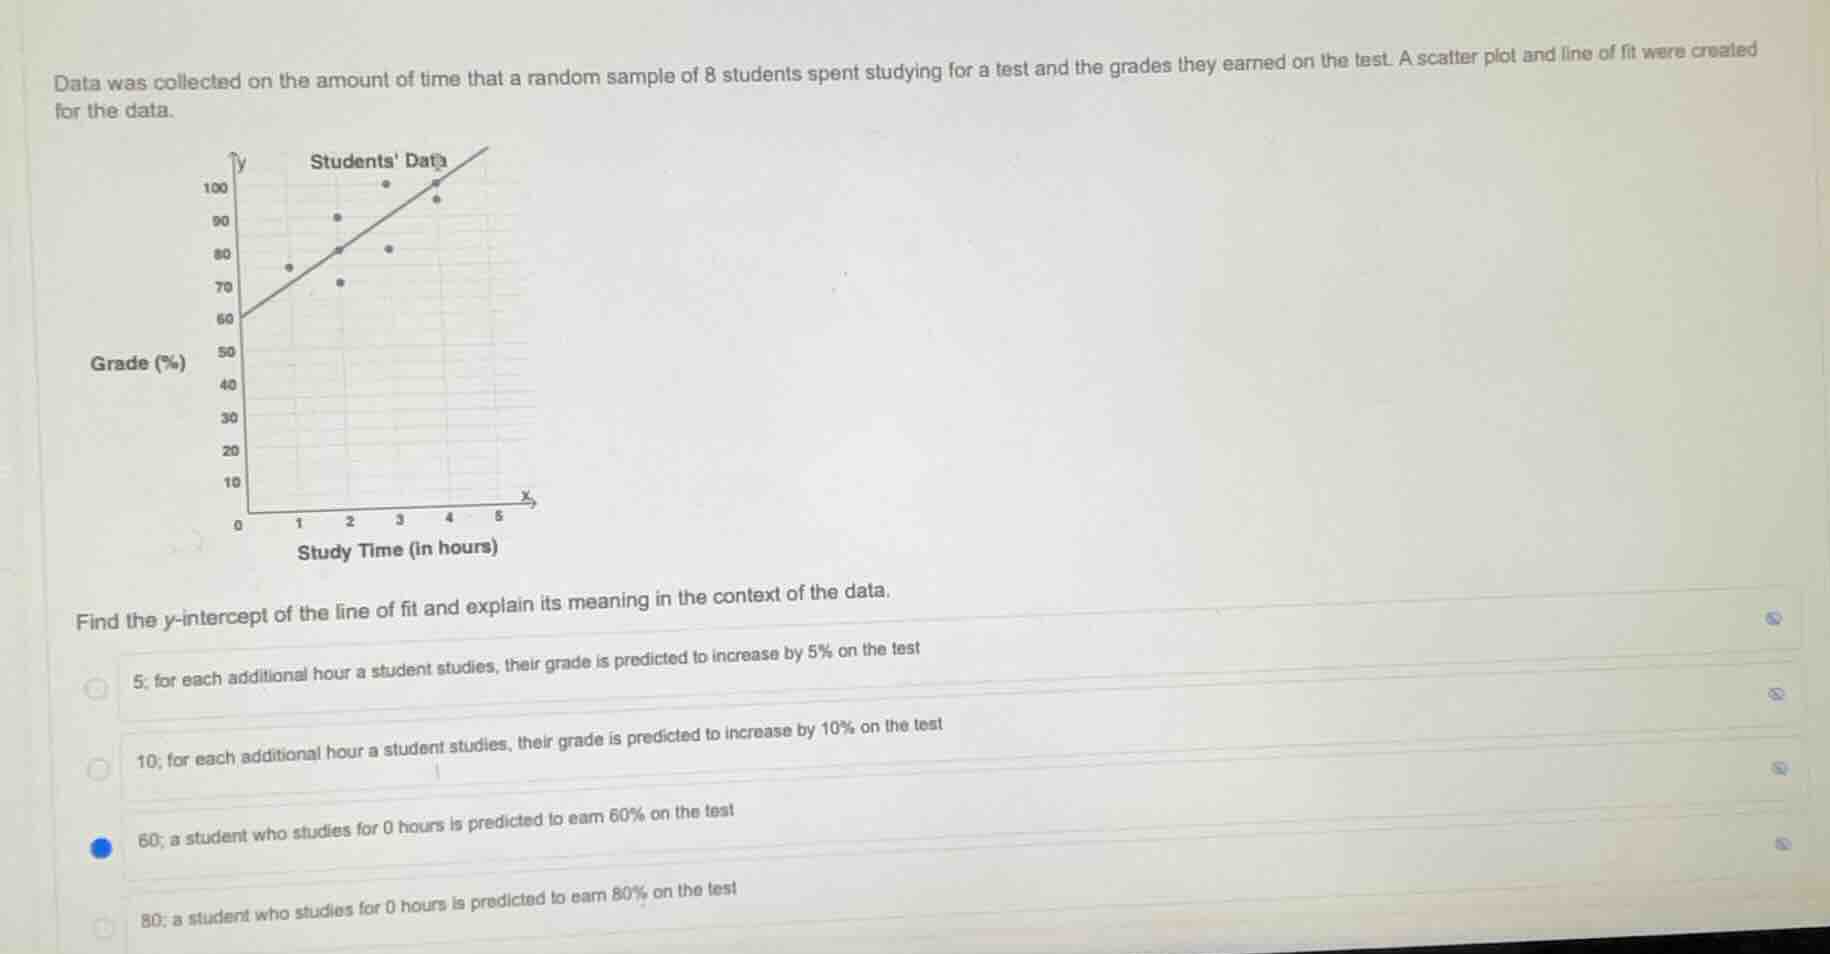
data was collected on the amount of time that a random sample of 8 students spent studying for a test and the grades they earned on the test. a scatter plot and line of fit were created for the data.
find the y-intercept of the line of fit and explain its meaning in the context of the data.
5; for each additional hour a student studies, their grade is predicted to increase by 5% on the test
10; for each additional hour a student studies, their grade is predicted to increase by 10% on the test
60; a student who studies for 0 hours is predicted to earn 60% on the test
80; a student who studies for 0 hours is predicted to earn 80% on the test
The y-intercept of a line is the value of y when x=0. On the scatter plot, the line of fit crosses the y-axis at y=60, where x (study time) is 0 hours. This corresponds to the predicted grade for a student who spends 0 hours studying.

Snap & solve any problem in the app
Get step-by-step solutions on Sovi AI
Photo-based solutions with guided steps
Explore more problems and detailed explanations
60; a student who studies for 0 hours is predicted to earn 60% on the test