QUESTION IMAGE
Question
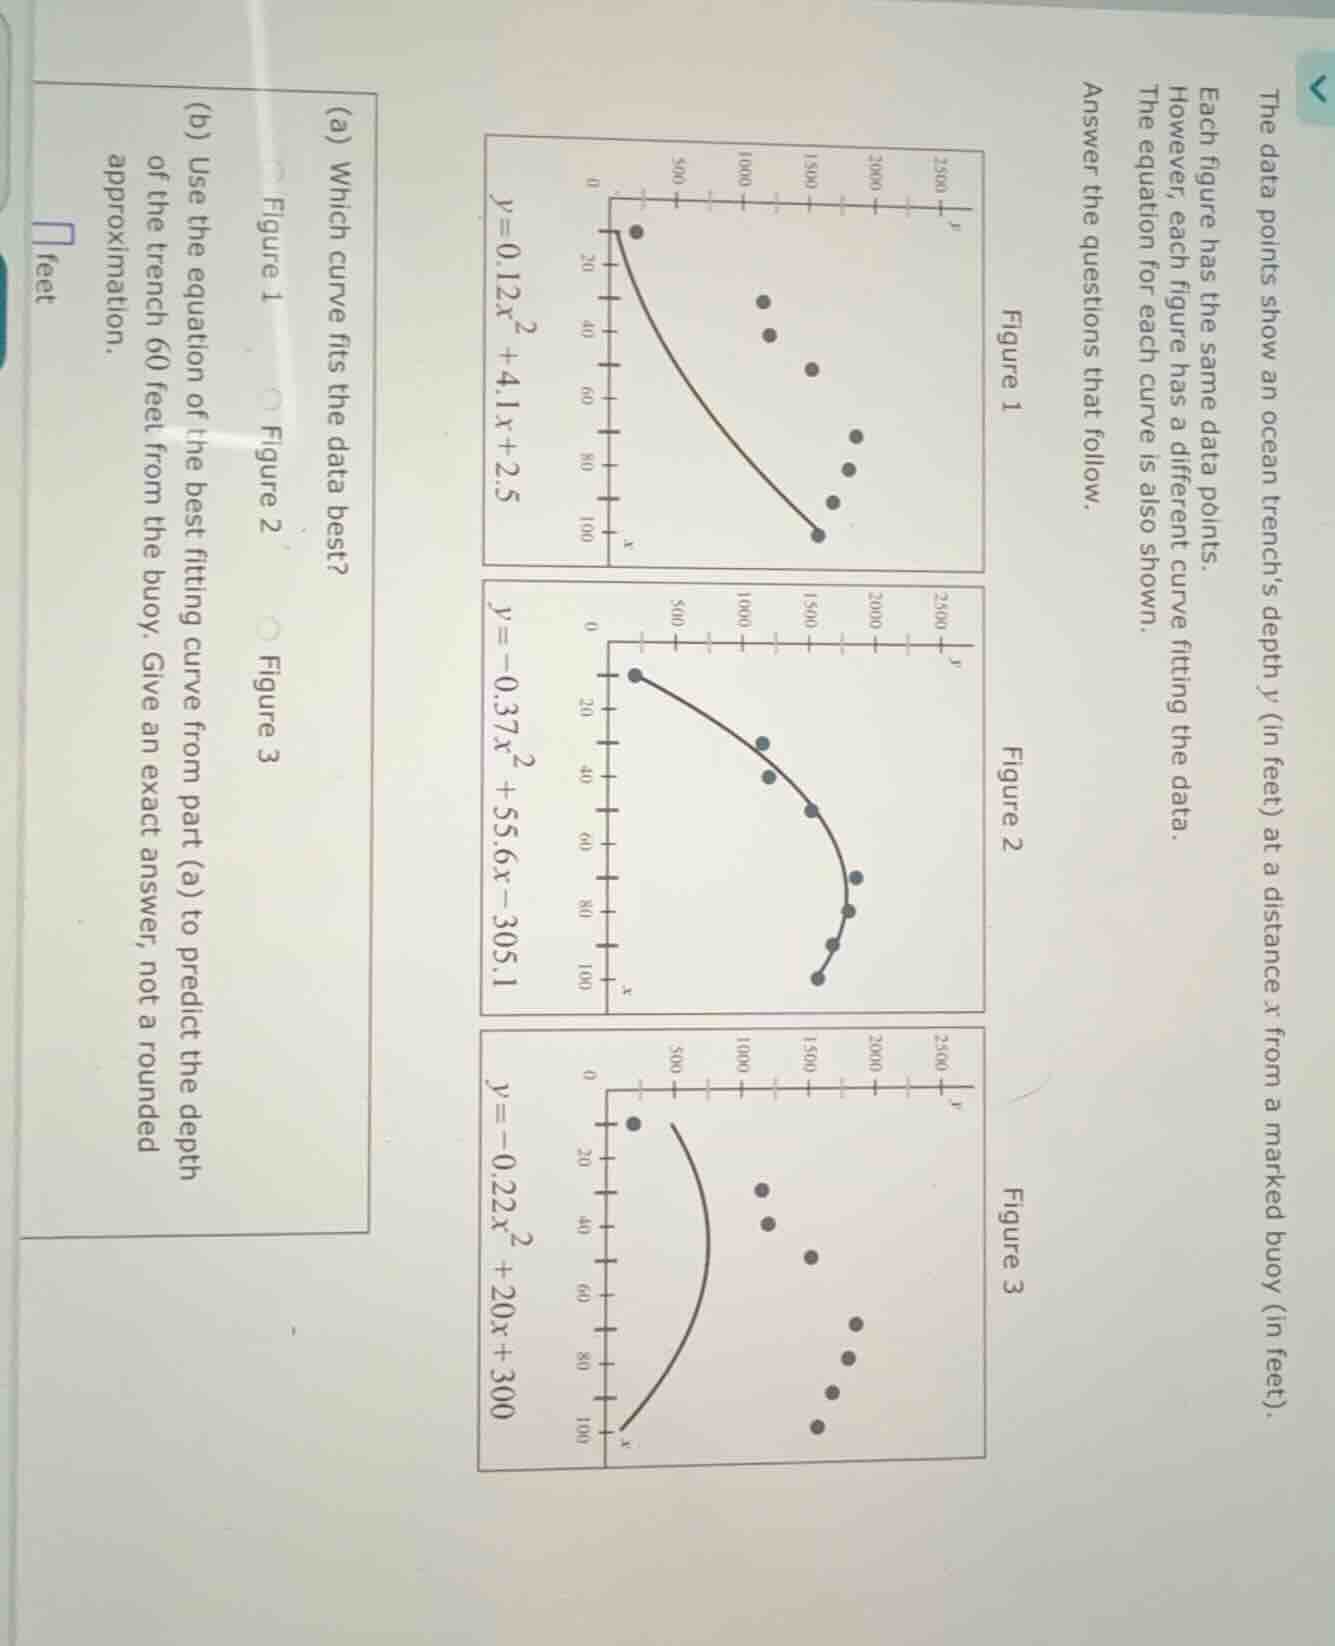
the data points show an ocean trench’s depth ( y ) (in feet) at a distance ( x ) from a marked buoy (in feet). each figure has the same data points. however, each figure has a different curve fitting the data. the equation for each curve is also shown. answer the questions that follow.
figure 1
graph of ( y = 0.12x^2 + 4.1x + 2.5 ) with data points
figure 2
graph of ( y = -0.37x^2 + 55.6x - 305.1 ) with data points
figure 3
graph of ( y = -0.22x^2 + 20x + 300 ) with data points
(a) which curve fits the data best?
( circ ) figure 1
( circ ) figure 2
( circ ) figure 3
(b) use the equation of the best - fitting curve from part (a) to predict the depth of the trench 60 feet from the buoy. give an exact answer, not a rounded approximation.
feet
Step1: Identify best fitting curve
Visually compare the data points to each curve: Figure 2's curve passes closest to all data points, while Figures 1 and 3 have curves that do not align with the point distribution.
Step2: Substitute x=60 into Figure 2's equation
The equation for Figure 2 is $y=-0.37x^2 + 55.6x - 305.1$. Substitute $x=60$:
Step3: Calculate the final value
Compute the arithmetic step-by-step:

Snap & solve any problem in the app
Get step-by-step solutions on Sovi AI
Photo-based solutions with guided steps
Explore more problems and detailed explanations
(a) Figure 2
(b) 1698.9 feet