QUESTION IMAGE
Question
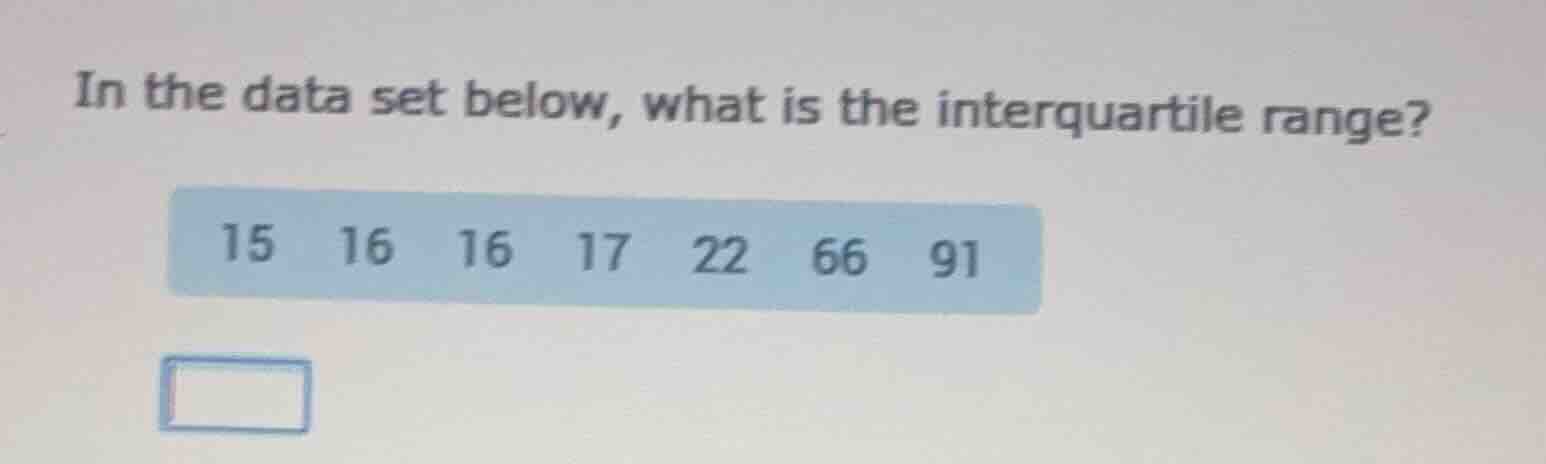
in the data set below, what is the interquartile range? 15 16 16 17 22 66 91
Step1: Order the data set
The data set is already ordered: \( 15, 16, 16, 17, 22, 66, 91 \)
Step2: Find the median (Q2)
The number of data points \( n = 7 \), which is odd. The median is the middle value, at position \( \frac{n + 1}{2}=\frac{7+1}{2} = 4 \). So the median (Q2) is the 4th value, which is \( 17 \).
Step3: Find Q1 (median of the lower half)
The lower half of the data (values below Q2) is \( 15, 16, 16 \). The number of values here is \( 3 \) (odd). The median of this lower half is the middle value, at position \( \frac{3 + 1}{2}=2 \). So Q1 is the 2nd value of the lower half, which is \( 16 \).
Step4: Find Q3 (median of the upper half)
The upper half of the data (values above Q2) is \( 22, 66, 91 \). The number of values here is \( 3 \) (odd). The median of this upper half is the middle value, at position \( \frac{3 + 1}{2}=2 \). So Q3 is the 2nd value of the upper half, which is \( 66 \).
Step5: Calculate the interquartile range (IQR)
The interquartile range is \( IQR=Q3 - Q1 \). Substituting the values of Q3 and Q1, we get \( IQR = 66-16=50 \).

Snap & solve any problem in the app
Get step-by-step solutions on Sovi AI
Photo-based solutions with guided steps
Explore more problems and detailed explanations
\( 50 \)