QUESTION IMAGE
Question
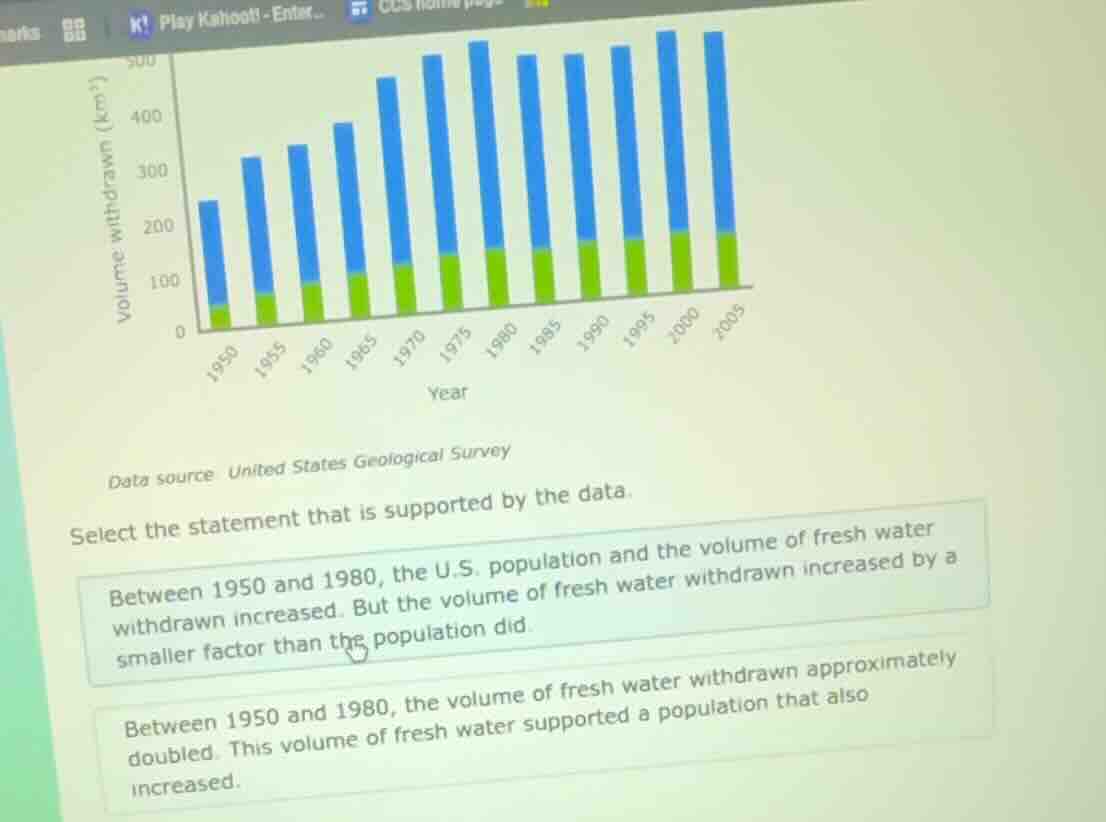
data source united states geological survey
select the statement that is supported by the data.
between 1950 and 1980, the u.s. population and the volume of fresh water withdrawn increased. but the volume of fresh water withdrawn increased by a smaller factor than the population did.
between 1950 and 1980, the volume of fresh water withdrawn approximately doubled. this volume of fresh water supported a population that also increased.
Brief Explanations
- Analyze the bar graph: In 1950, the total water withdrawn is ~240 km³; in 1980, it is ~520 km³. Calculate the growth factor: $\frac{520}{240} \approx 2.17$, meaning the water volume nearly doubled.
- Evaluate the first statement: It claims water withdrawal increased by a smaller factor than population. But the graph shows water volume nearly doubled, and typical U.S. population growth 1950-1980 was ~1.5x, so water grew by a larger factor. This statement is incorrect.
- Evaluate the second statement: It states water withdrawal approximately doubled 1950-1980, and this volume supported an increased population. The graph confirms water nearly doubled, and U.S. population did increase in this period, so this matches the data.

Snap & solve any problem in the app
Get step-by-step solutions on Sovi AI
Photo-based solutions with guided steps
Explore more problems and detailed explanations
Between 1950 and 1980, the volume of fresh water withdrawn approximately doubled. This volume of fresh water supported a population that also increased.