QUESTION IMAGE
Question
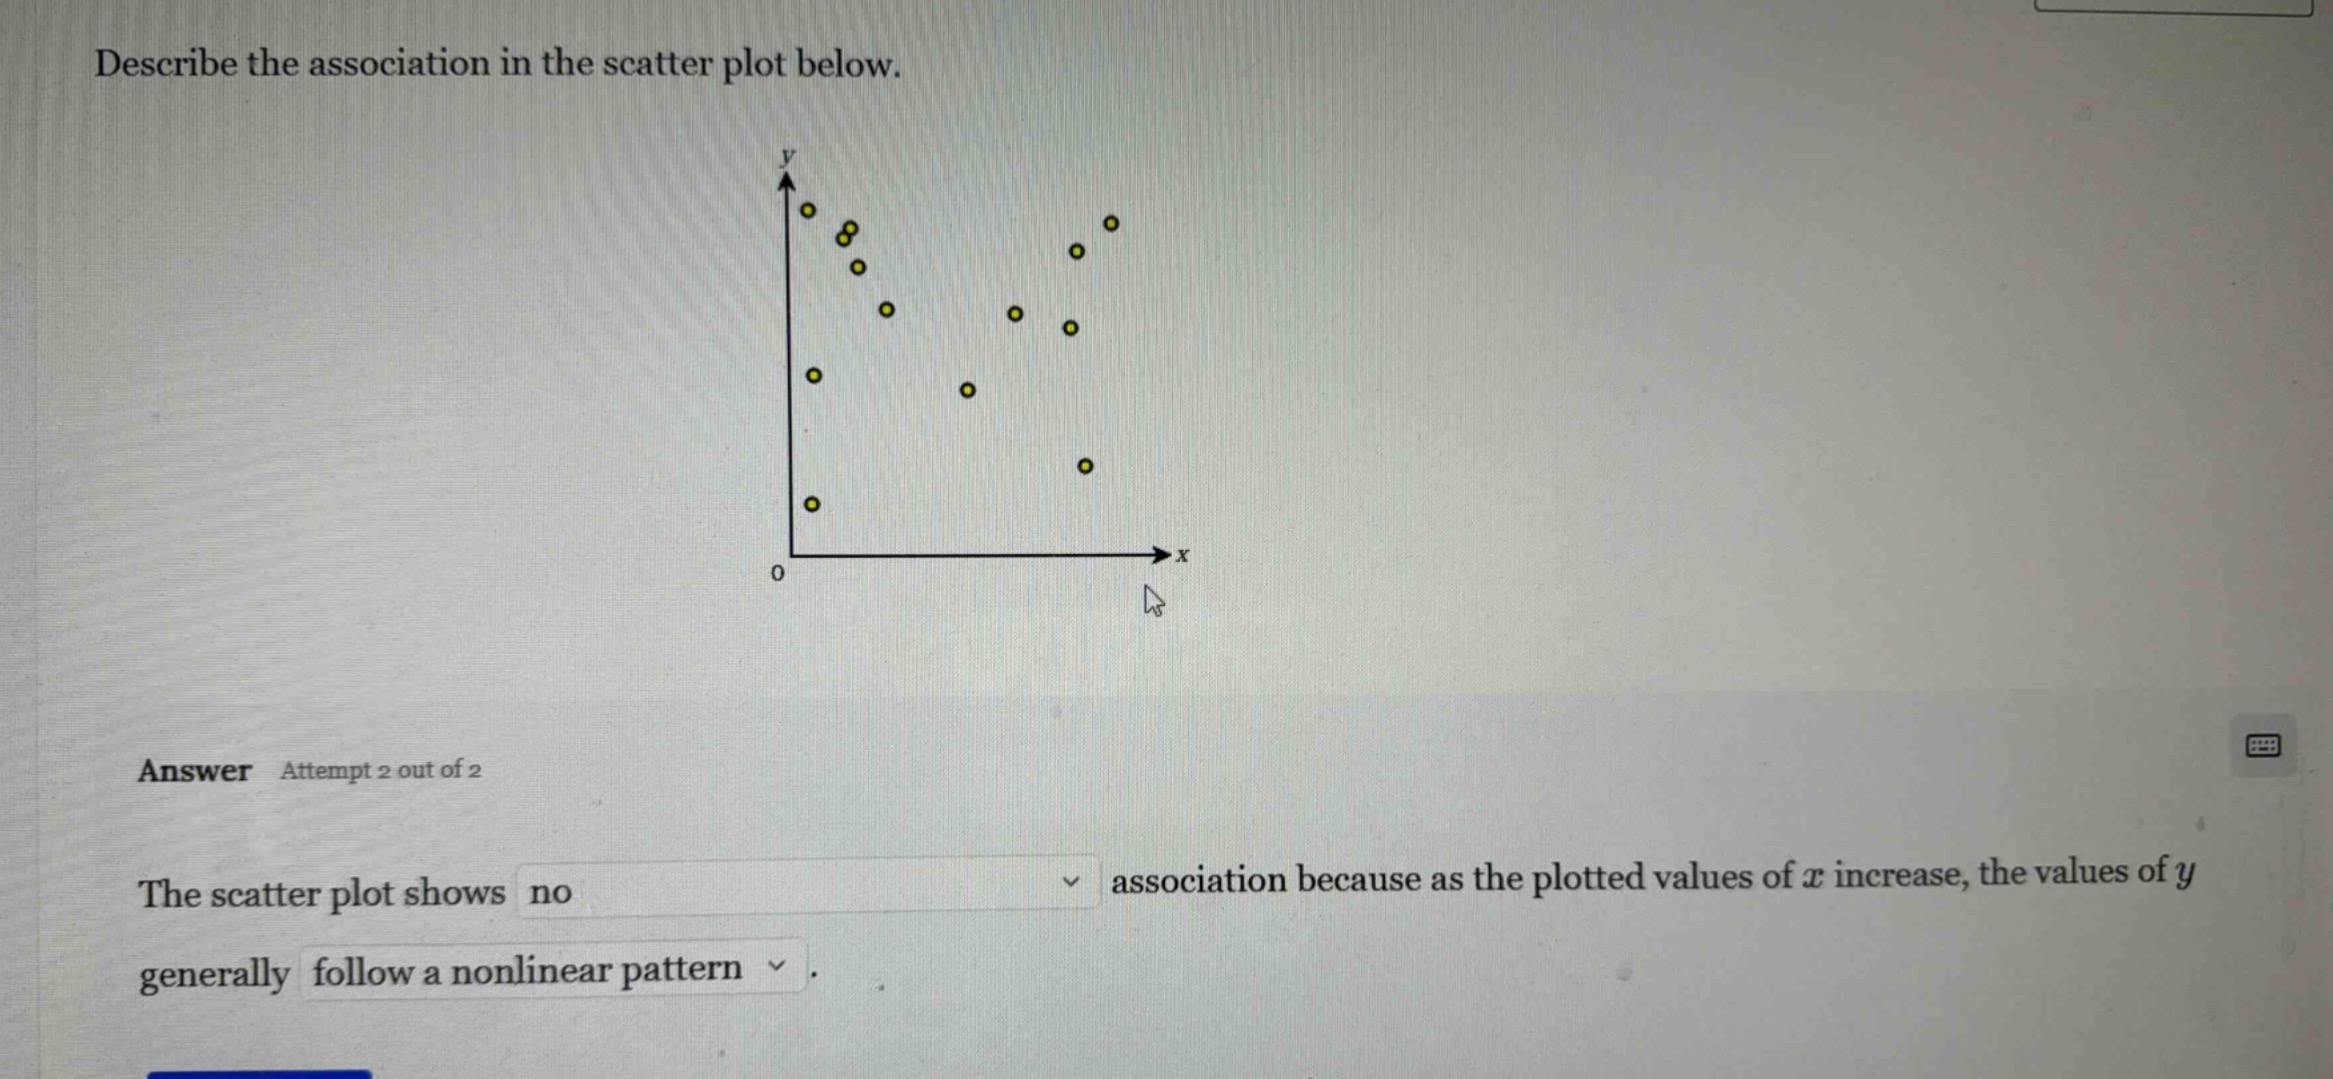
describe the association in the scatter plot below.
answer attempt 2 out of 2
the scatter plot shows no association because as the plotted values of ( x ) increase, the values of ( y ) generally follow a nonlinear pattern.
To determine the association in a scatter plot, we analyze the pattern of the points as \( x \) increases. If there's no clear linear or consistent trend (like increasing, decreasing, or a specific curve), and the points are scattered without a discernible pattern, we say there's no association. Here, as \( x \) increases, \( y \) values don't show a linear trend or a consistent nonlinear trend—they're scattered, so the association is "no" and the \( y \)-values follow a nonlinear (or random - like) pattern.

Snap & solve any problem in the app
Get step-by-step solutions on Sovi AI
Photo-based solutions with guided steps
Explore more problems and detailed explanations
The scatter plot shows no association because as the plotted values of \( x \) increase, the values of \( y \) generally follow a nonlinear pattern.