QUESTION IMAGE
Question
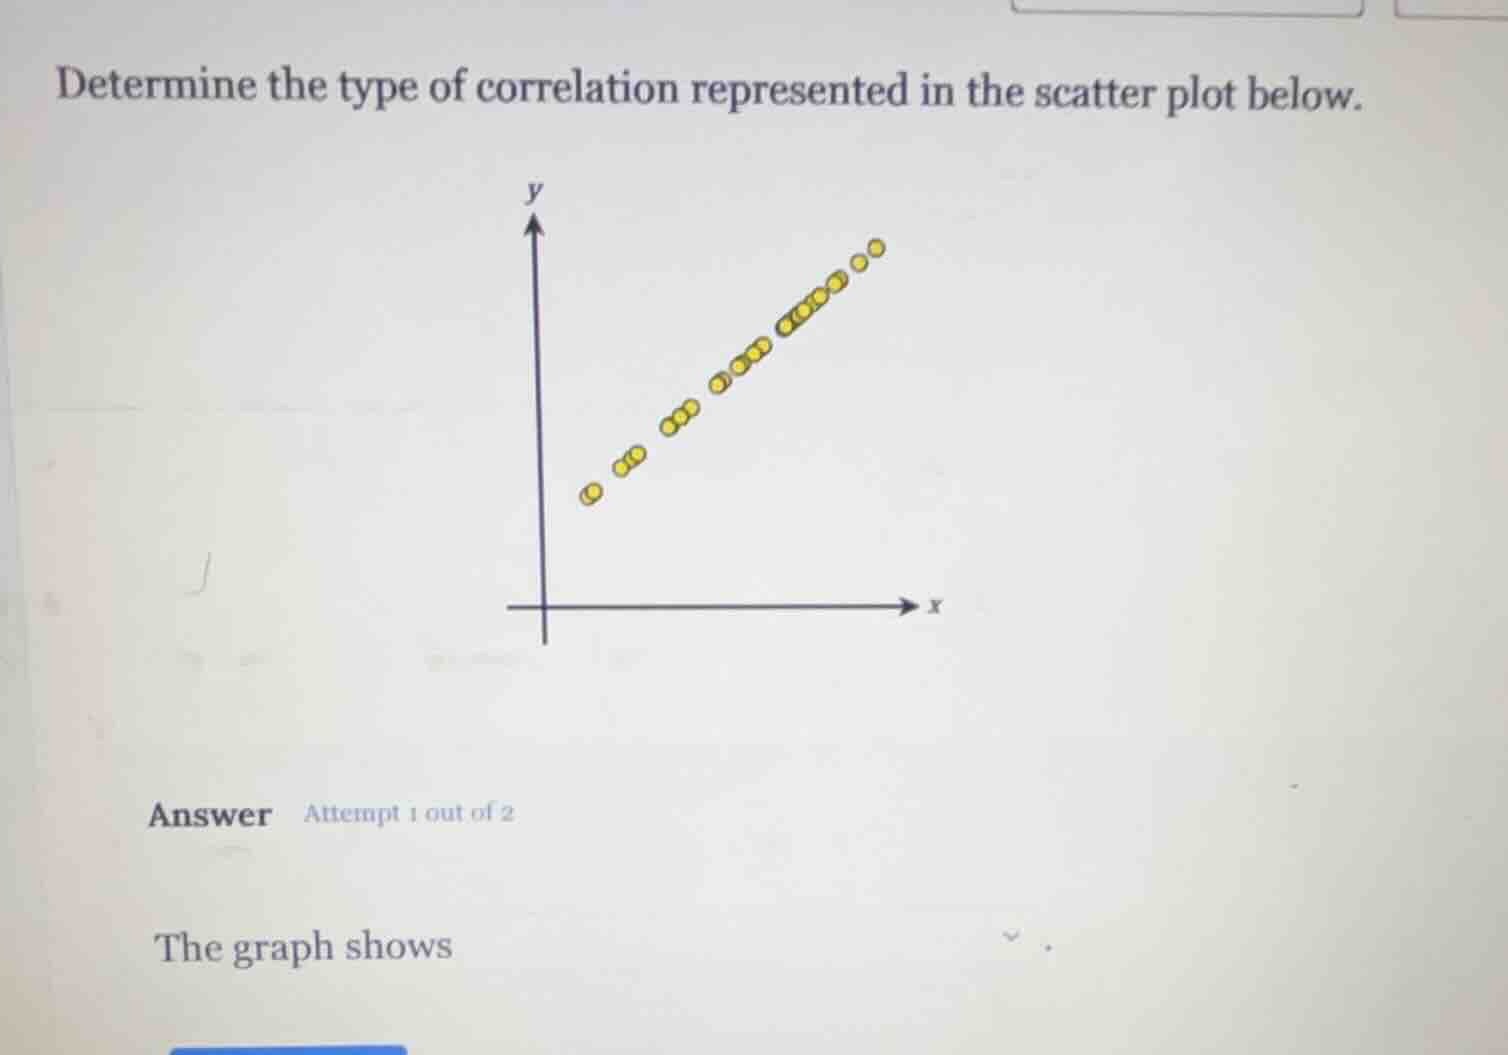
determine the type of correlation represented in the scatter plot below.
answer attempt 1 out of 2
the graph shows
Brief Explanations
The scatter plot has points that form a clear upward trend: as the x-values increase, the y-values consistently increase, and the points are tightly clustered along this upward slope. This pattern matches the definition of a strong positive correlation.

Snap & solve any problem in the app
Get step-by-step solutions on Sovi AI
Photo-based solutions with guided steps
Explore more problems and detailed explanations
a strong positive correlation