QUESTION IMAGE
Question
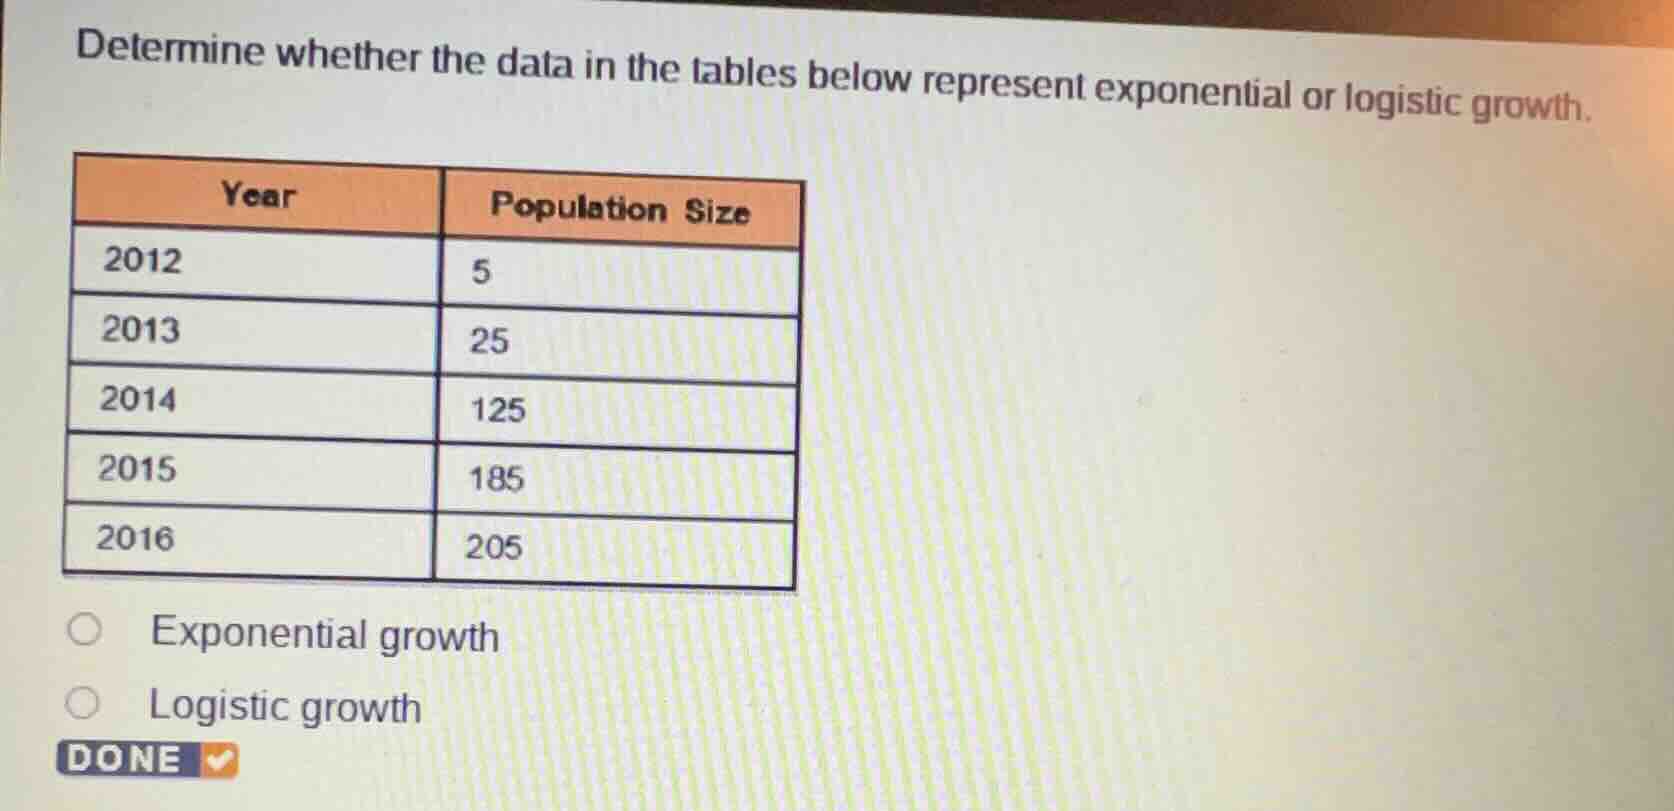
determine whether the data in the tables below represent exponential or logistic growth.
year population size
2012 5
2013 25
2014 125
2015 185
2016 205
exponential growth
logistic growth
Step1: Calculate growth ratios
2013: $\frac{25}{5}=5$; 2014: $\frac{125}{25}=5$; 2015: $\frac{185}{125}=1.48$; 2016: $\frac{205}{185}\approx1.108$
Step2: Analyze growth pattern
Exponential growth has constant ratio; here growth slows, approaching a limit.

Snap & solve any problem in the app
Get step-by-step solutions on Sovi AI
Photo-based solutions with guided steps
Explore more problems and detailed explanations
Logistic growth