QUESTION IMAGE
Question
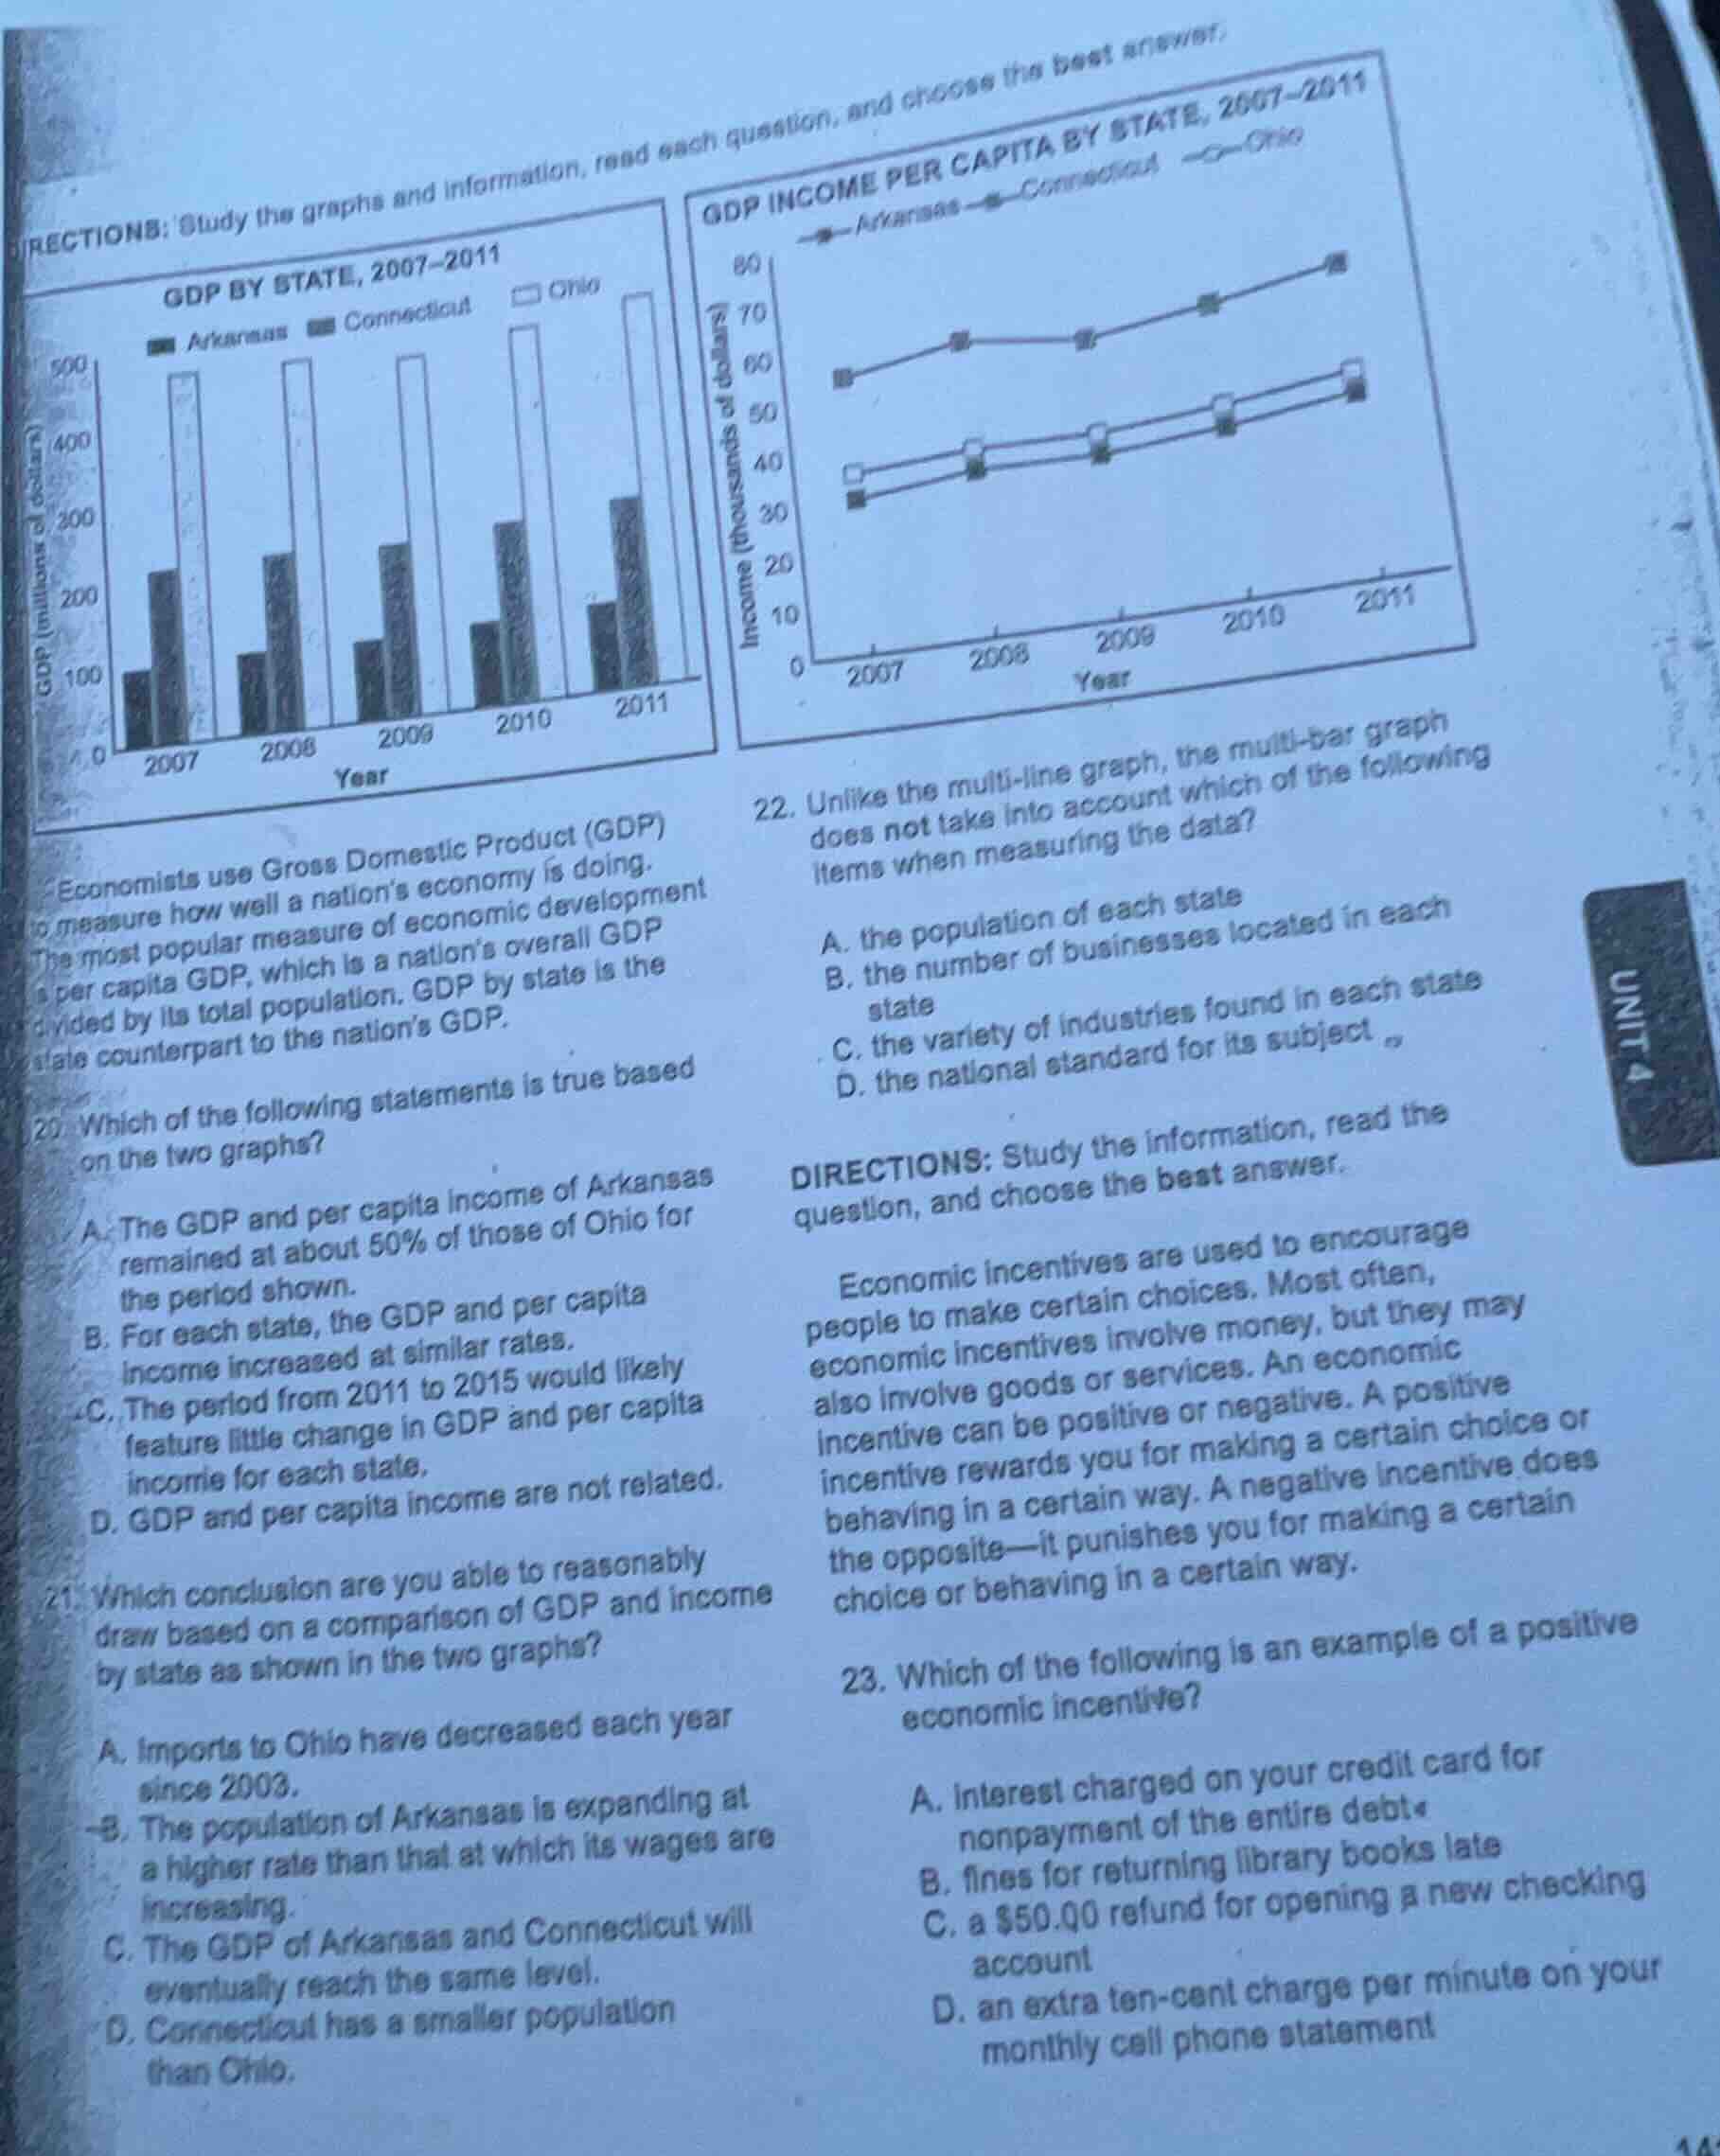
directions: study the graphs and information, read each question, and choose the best answer.gdp by state, 2007-2011gdp income per capita by state, 2007-2011economists use gross domestic product (gdp) to measure how well a nations economy is doing. the most popular measure of economic development is per capita gdp, which is a nations overall gdp divided by its total population. gdp by state is the state counterpart to the nations gdp.20. which of the following statements is true based on the two graphs?a. the gdp and per capita income of arkansas remained at about 50% of those of ohio for the period shown.b. for each state, the gdp and per capita income increased at similar rates.c. the period from 2011 to 2015 would likely feature little change in gdp and per capita income for each state.d. gdp and per capita income are not related.21. which conclusion are you able to reasonably draw based on a comparison of gdp and income by state as shown in the two graphs?a. imports to ohio have decreased each year since 2003.b. the population of arkansas is expanding at a higher rate than that at which its wages are increasing.c. the gdp of arkansas and connecticut will eventually reach the same level.d. connecticut has a smaller population than ohio.22. unlike the multi-line graph, the multi-bar graph does not take into account which of the following items when measuring the data?a. the population of each stateb. the number of businesses located in each statec. the variety of industries found in each stated. the national standard for its subjectdirections: study the information, read the question, and choose the best answer.economic incentives are used to encourage people to make certain choices. most often, economic incentives involve money, but they may also involve goods or services. an economic incentive can be positive or negative. a positive incentive rewards you for making a certain choice or behaving in a certain way. a negative incentive does the opposite—it punishes you for making a certain choice or behaving in a certain way.23. which of the following is an example of a positive economic incentive?a. interest charged on your credit card for nonpayment of the entire debtb. fines for returning library books latec. a $50.00 refund for opening a new checking accountd. an extra ten-cent charge per minute on your monthly cell phone statement
- Analyze the two graphs: Arkansas's GDP is ~25-30% of Ohio's, and its per capita income is ~60-70% of Ohio's, so A is wrong. Each state's GDP and per capita income grew at similar upward rates, so B is correct. No data supports C, and GDP and per capita income are related (per capita = GDP/population), so D is wrong.
- No import data exists, so A is wrong. Arkansas's GDP and per capita income both grew, so B is unsupported. No trend shows their GDPs will equal, so C is wrong. Connecticut has lower total GDP than Ohio but higher per capita income; since $\text{Per Capita GDP} = \frac{\text{Total GDP}}{\text{Population}}$, lower total GDP + higher per capita means smaller population, so D is correct.
- Per capita GDP accounts for population, while total GDP does not. The bar graph is total GDP, the line graph is per capita. So population is the factor the bar graph ignores, making A correct.
- Positive incentives reward a choice. A, B, D are punishments (negative incentives); a $50 refund for opening an account is a reward, so C is correct.

Snap & solve any problem in the app
Get step-by-step solutions on Sovi AI
Photo-based solutions with guided steps
Explore more problems and detailed explanations
- B. For each state, the GDP and per capita income increased at similar rates.
- D. Connecticut has a smaller population than Ohio.
- A. the population of each state
- C. a $50.00 refund for opening a new checking account