QUESTION IMAGE
Question
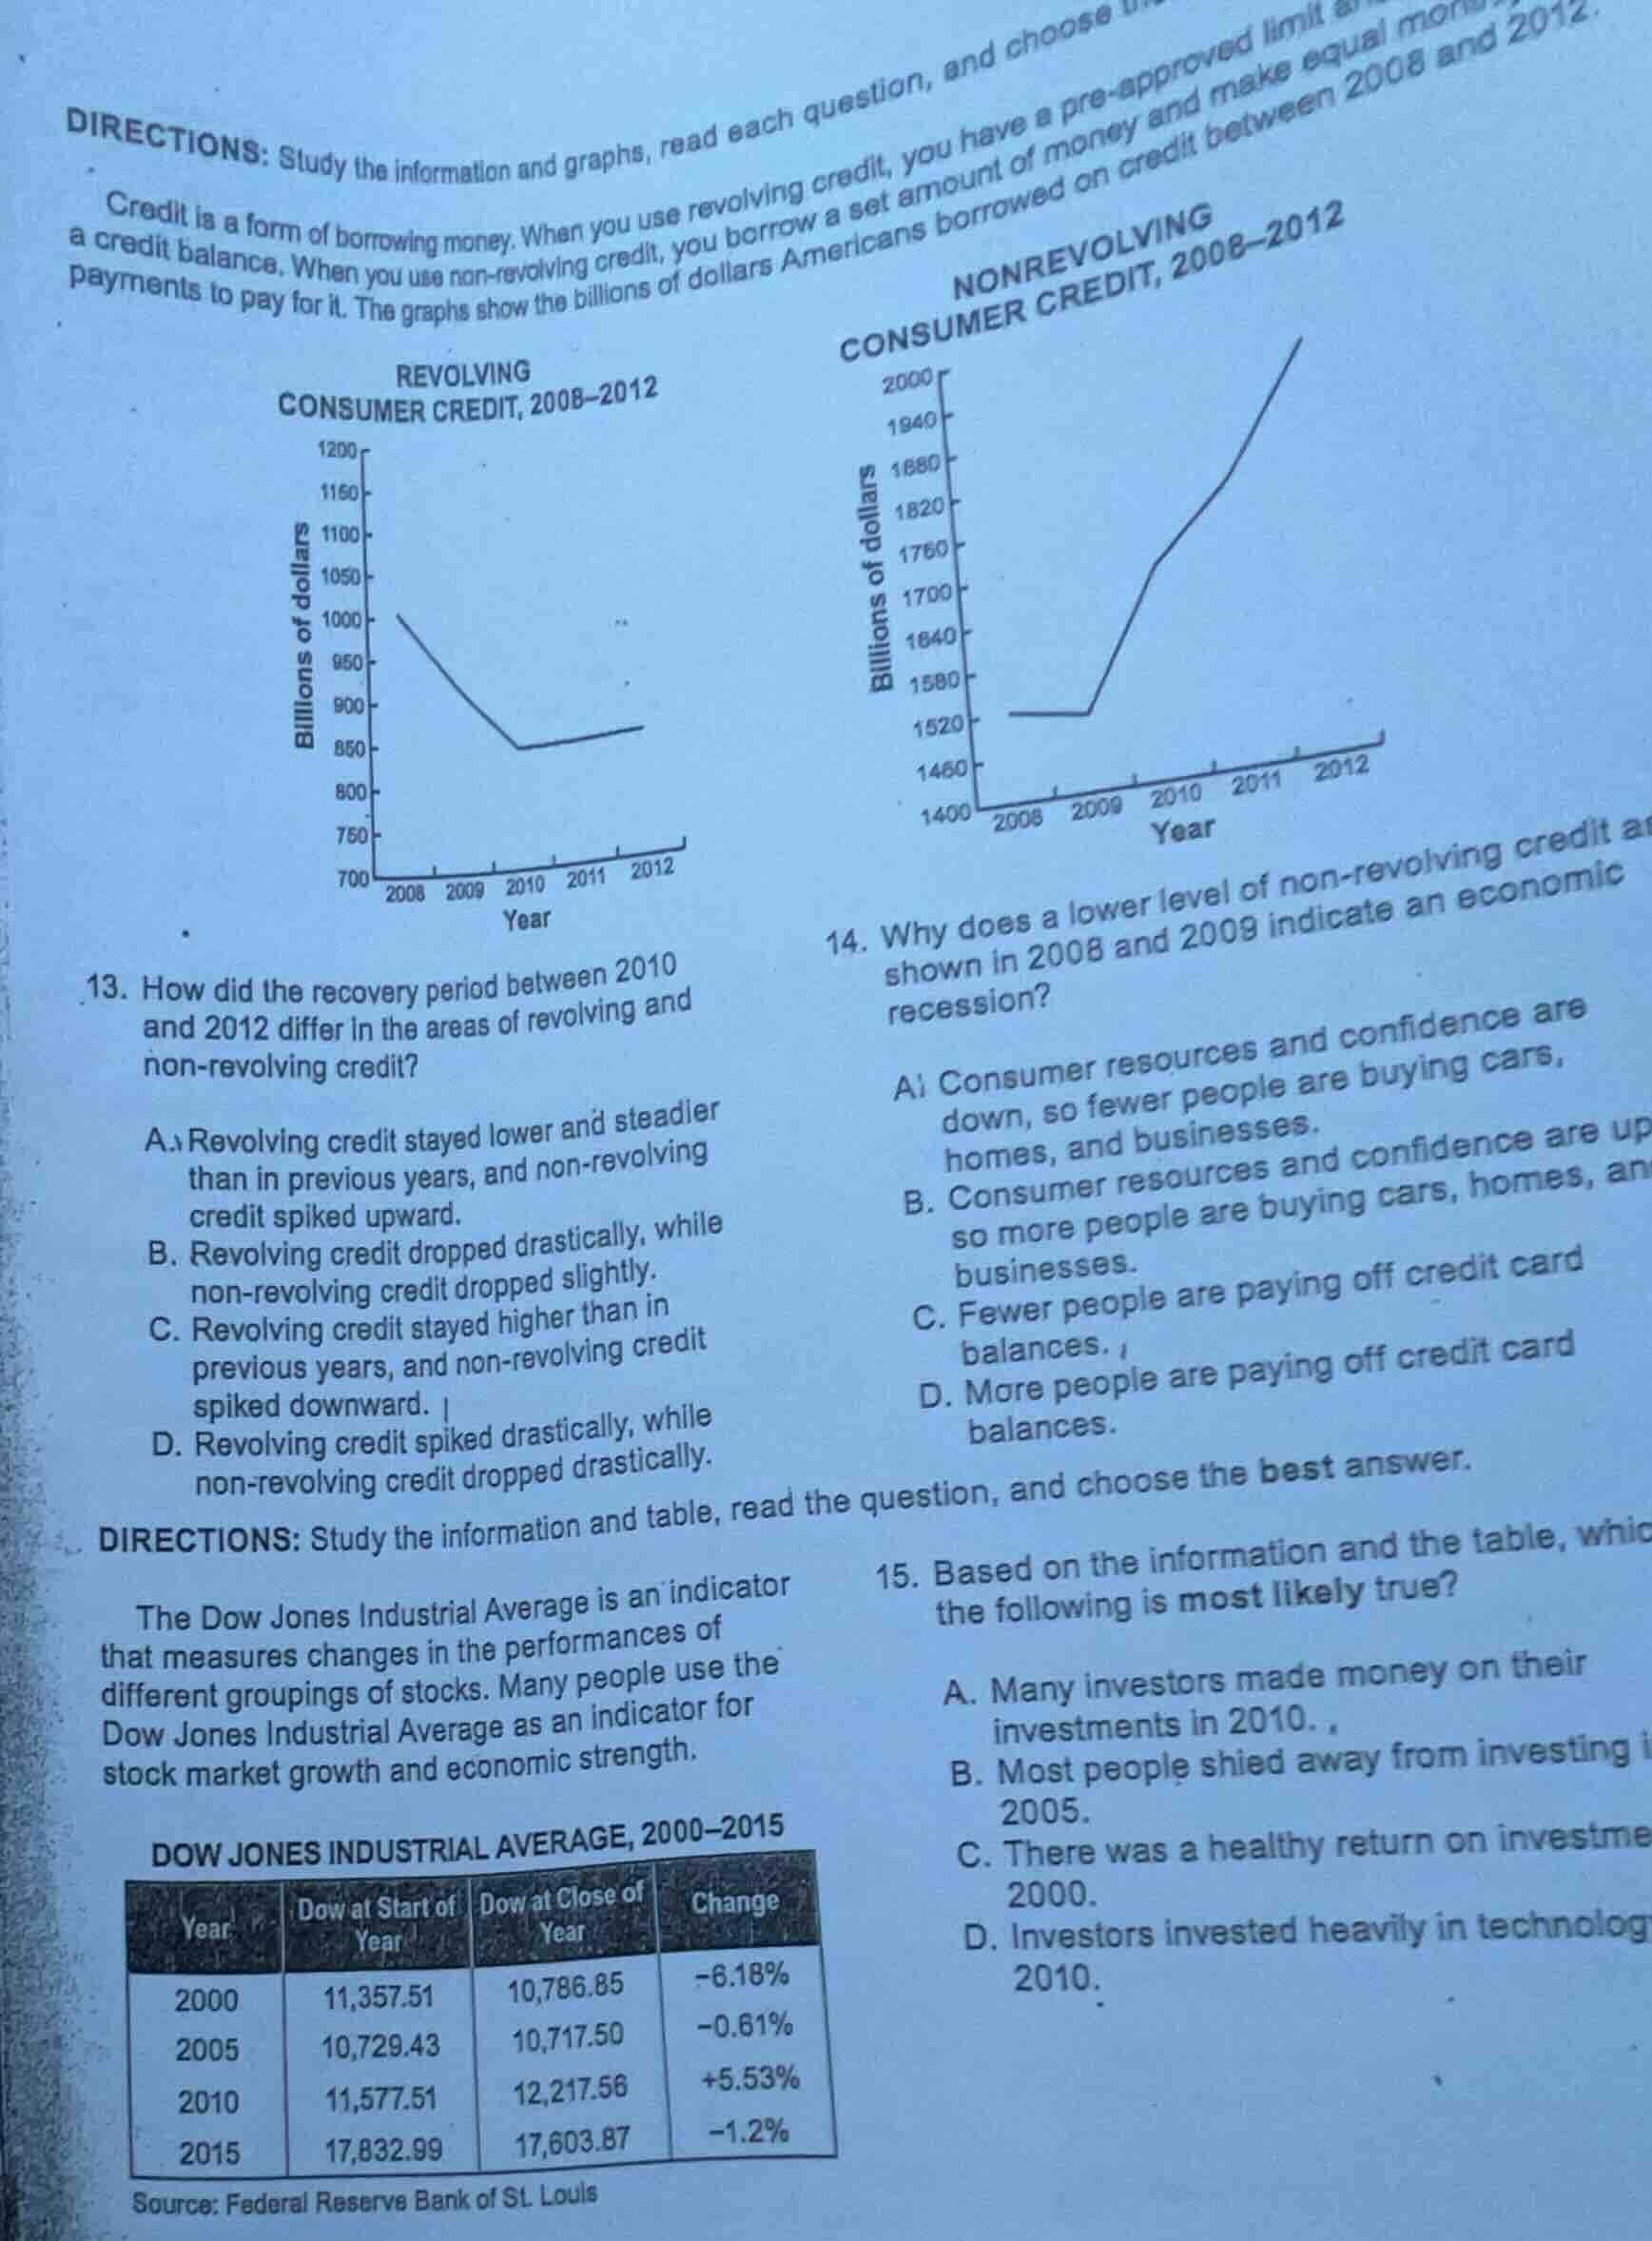
directions: study the information and graphs, read each question, and choosecredit is a form of borrowing money. when you use revolving credit, you have a pre-approved limit a credit balance. when you use non-revolving credit, you borrow a set amount of money and make equal mon payments to pay for it. the graphs show the billions of dollars americans borrowed on credit between 2008 and 2012.revolvingconsumer credit, 2008-2012nonrevolvingconsumer credit, 2008-201213. how did the recovery period between 2010 and 2012 differ in the areas of revolving and non-revolving credit?a. revolving credit stayed lower and steadier than in previous years, and non-revolving credit spiked upward.b. revolving credit dropped drastically, while non-revolving credit dropped slightly.c. revolving credit stayed higher than in previous years, and non-revolving credit spiked downward.d. revolving credit spiked drastically, while non-revolving credit dropped drastically.14. why does a lower level of non-revolving credit a shown in 2008 and 2009 indicate an economic recession?a. consumer resources and confidence are down, so fewer people are buying cars, homes, and businesses.b. consumer resources and confidence are up so more people are buying cars, homes, an businesses.c. fewer people are paying off credit card balances.d. more people are paying off credit card balances.directions: study the information and table, read the question, and choose the best answer.the dow jones industrial average is an indicator that measures changes in the performances of different groupings of stocks. many people use the dow jones industrial average as an indicator for stock market growth and economic strength.dow jones industrial average, 2000-2015| year | dow at start of year | dow at close of year | change || ---- | ---- | ---- | ---- || 2000 | 11,357.51 | 10,786.85 | -6.18% || 2005 | 10,729.43 | 10,717.50 | -0.61% || 2010 | 11,577.51 | 12,217.56 | +5.53% || 2015 | 17,832.99 | 17,603.87 | -1.2% |source: federal reserve bank of st. louis15. based on the information and the table, whic the following is most likely true?a. many investors made money on their investments in 2010.b. most people shied away from investing i 2005.c. there was a healthy return on investme 2000.d. investors invested heavily in technolog 2010.
For Question 13:
Analyze the two line graphs: the revolving credit graph shows it stayed at a lower, steady level after 2010, while the non-revolving credit graph shows a sharp upward spike between 2010-2012. This matches option A.
For Question 14:
Non-revolving credit is used for large purchases like cars, homes, or business assets. In a recession, consumers have less money and low confidence, so they avoid these large purchases, leading to lower non-revolving credit. This matches option A.
For Question 15:
Check the 2010 data in the table: the Dow Jones had a +5.53% change, meaning the index rose, so many investors would have made money on their investments. This matches option A.

Snap & solve any problem in the app
Get step-by-step solutions on Sovi AI
Photo-based solutions with guided steps
Explore more problems and detailed explanations
- A. Revolving credit stayed lower and steadier than in previous years, and non-revolving credit spiked upward.
- A. Consumer resources and confidence are down, so fewer people are buying cars, homes, and businesses.
- A. Many investors made money on their investments in 2010.