QUESTION IMAGE
Question
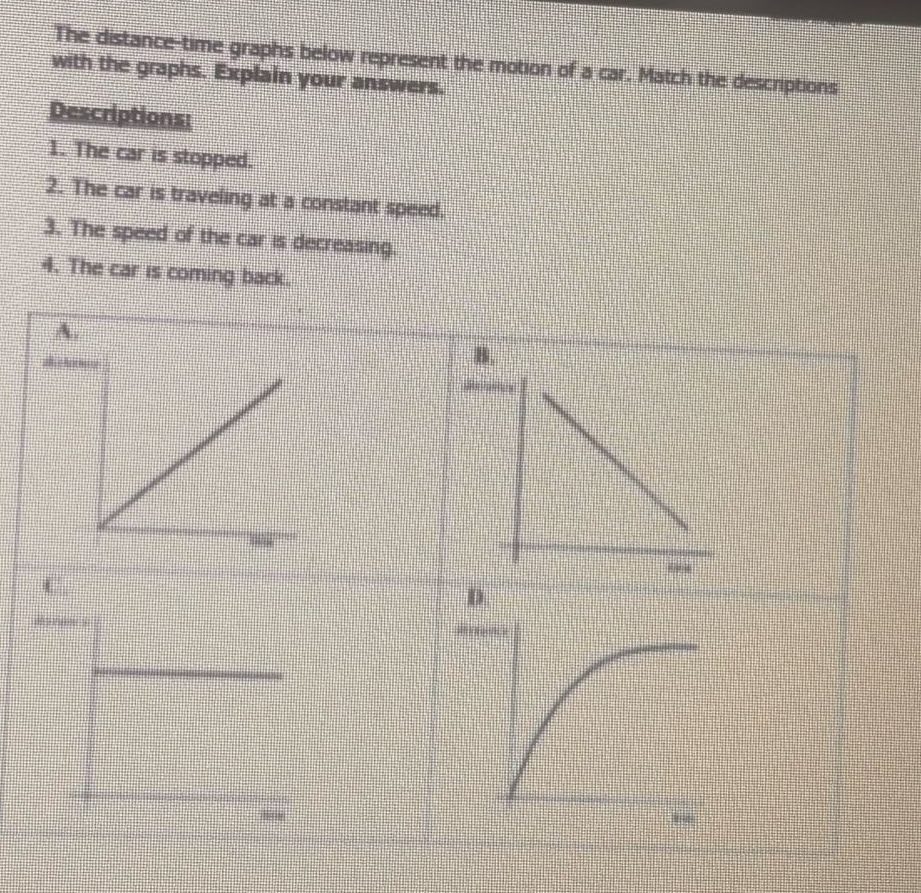
the distance - time graphs below represent the motion of a car. match the descriptions with the graphs. explain your answers.
descriptions:
- the car is stopped.
- the car is traveling at a constant speed.
- the speed of the car is decreasing.
- the car is coming back.
Brief Explanations
- For "The car is stopped": In a distance - time graph, when the distance remains constant as time passes, the car is not moving. Graph C has a horizontal line, meaning distance doesn't change with time, so it matches this description.
- For "The car is traveling at a constant speed": A distance - time graph with a straight - line (constant slope) represents constant speed because speed $v=\frac{\Delta d}{\Delta t}$, and a constant slope means a constant ratio of distance change to time change. Graph A is a straight line through the origin, so it has a constant slope, matching this description.
- For "The speed of the car is decreasing": The slope of a distance - time graph represents speed. If the slope is getting smaller (the graph is curving and the rate of increase of distance with time is decreasing), the speed is decreasing. Graph D is a curve that is flattening out, so its slope is decreasing, matching this description.
- For "The car is coming back": When the distance from the starting point is decreasing as time increases, the car is moving back towards the start. Graph B shows distance decreasing with time (a negative slope), so it matches this description.

Snap & solve any problem in the app
Get step-by-step solutions on Sovi AI
Photo-based solutions with guided steps
Explore more problems and detailed explanations
- The car is stopped: C
- The car is traveling at a constant speed: A
- The speed of the car is decreasing: D
- The car is coming back: B