QUESTION IMAGE
Question
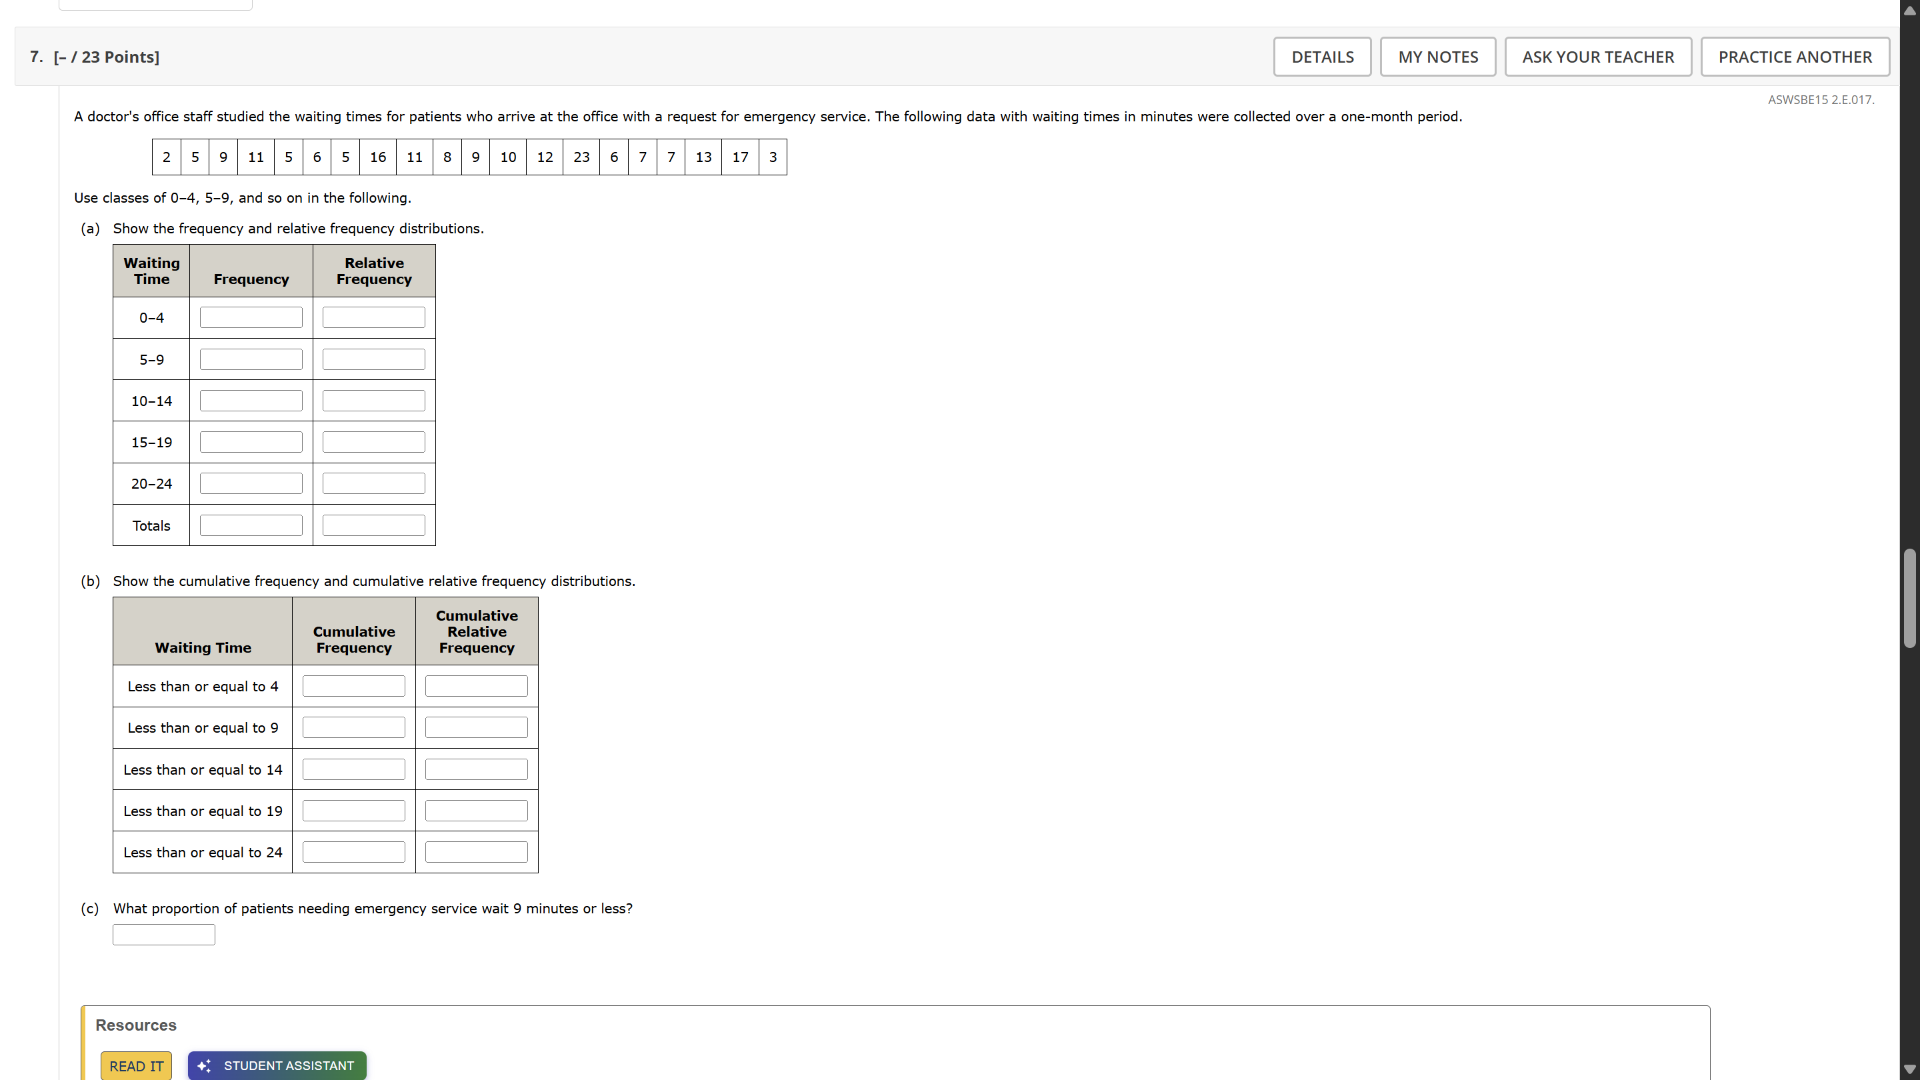
a doctors office staff studied the waiting times for patients who arrive at the office with a request for emergency service. the following data with waiting times in minutes were collected over a one - month period.
2 5 9 11 5 6 5 16 11 8 9 10 12 23 6 7 7 13 17 3
use classes of 0 - 4, 5 - 9, and so on in the following.
(a) show the frequency and relative frequency distributions.
| waiting time | frequency | relative frequency |
|---|---|---|
| 5 - 9 | ||
| 10 - 14 | ||
| 15 - 19 | ||
| 20 - 24 | ||
| totals |
(b) show the cumulative frequency and cumulative relative frequency distributions.
| waiting time | cumulative frequency | cumulative relative frequency |
|---|---|---|
| less than or equal to 9 | ||
| less than or equal to 14 | ||
| less than or equal to 19 | ||
| less than or equal to 24 |
(c) what proportion of patients needing emergency service wait 9 minutes or less?
Part (a)
Step1: Count data in each class
First, list the data: 2, 5, 9, 11, 5, 6, 5, 16, 11, 8, 9, 10, 12, 23, 6, 7, 7, 13, 17, 3. Total data points \( n = 20 \).
- Class 0–4: Values are 2, 3. So frequency \( f_1 = 2 \).
- Class 5–9: Values are 5, 9, 5, 6, 5, 8, 9, 6, 7, 7. Count: 10. So \( f_2 = 10 \).
- Class 10–14: Values are 11, 11, 10, 12, 13. Count: 5. So \( f_3 = 5 \).
- Class 15–19: Values are 16, 17. Count: 2. So \( f_4 = 2 \).
- Class 20–24: Values are 23. Count: 1. So \( f_5 = 1 \).
Step2: Calculate relative frequency
Relative frequency \( = \frac{\text{frequency}}{\text{total number of data points}} \).
- For 0–4: \( \frac{2}{20} = 0.1 \)
- For 5–9: \( \frac{10}{20} = 0.5 \)
- For 10–14: \( \frac{5}{20} = 0.25 \)
- For 15–19: \( \frac{2}{20} = 0.1 \)
- For 20–24: \( \frac{1}{20} = 0.05 \)
Total frequency: \( 2 + 10 + 5 + 2 + 1 = 20 \). Total relative frequency: \( 0.1 + 0.5 + 0.25 + 0.1 + 0.05 = 1 \).
| Waiting Time | Frequency | Relative Frequency |
|---|---|---|
| 5–9 | 10 | 0.5 |
| 10–14 | 5 | 0.25 |
| 15–19 | 2 | 0.1 |
| 20–24 | 1 | 0.05 |
| Totals | 20 | 1 |
Part (b)
Step1: Calculate cumulative frequency
Cumulative frequency for a class is the sum of frequencies of all previous classes (including itself).
- Less than or equal to 4 (class 0–4): Frequency is 2. Cumulative frequency \( = 2 \).
- Less than or equal to 9 (class 0–4 + 5–9): \( 2 + 10 = 12 \).
- Less than or equal to 14 (class 0–4 + 5–9 + 10–14): \( 2 + 10 + 5 = 17 \).
- Less than or equal to 19 (class 0–4 + 5–9 + 10–14 + 15–19): \( 2 + 10 + 5 + 2 = 19 \).
- Less than or equal to 24 (all classes): \( 2 + 10 + 5 + 2 + 1 = 20 \).
Step2: Calculate cumulative relative frequency
Cumulative relative frequency \( = \frac{\text{cumulative frequency}}{\text{total number of data points}} \).
- Less than or equal to 4: \( \frac{2}{20} = 0.1 \)
- Less than or equal to 9: \( \frac{12}{20} = 0.6 \)
- Less than or equal to 14: \( \frac{17}{20} = 0.85 \)
- Less than or equal to 19: \( \frac{19}{20} = 0.95 \)
- Less than or equal to 24: \( \frac{20}{20} = 1 \)
| Waiting Time | Cumulative Frequency | Cumulative Relative Frequency |
|---|---|---|
| Less than or equal to 9 | 12 | 0.6 |
| Less than or equal to 14 | 17 | 0.85 |
| Less than or equal to 19 | 19 | 0.95 |
| Less than or equal to 24 | 20 | 1 |
Part (c)
Step1: Identify relevant class
We need the proportion of patients waiting 9 minutes or less. From part (b), the cumulative frequency for "less than or equal to 9" is 12, and total data points \( n = 20 \).
Step2: Calculate proportion
Proportion \( = \frac{\text{cumulative frequency for } \leq 9}{\text{total number of data points}} = \frac{12}{20} = 0.6 \).

Snap & solve any problem in the app
Get step-by-step solutions on Sovi AI
Photo-based solutions with guided steps
Explore more problems and detailed explanations
(a)
| Waiting Time | Frequency | Relative Frequency |
|---|---|---|
| 5–9 | 10 | 0.5 |
| 10–14 | 5 | 0.25 |
| 15–19 | 2 | 0.1 |
| 20–24 | 1 | 0.05 |
| Totals | 20 | 1 |
(b)
| Waiting Time | Cumulative Frequency | Cumulative Relative Frequency |
|---|---|---|
| Less than or equal to 9 | 12 | 0.6 |
| Less than or equal to 14 | 17 | 0.85 |
| Less than or equal to 19 | 19 | 0.95 |
| Less than or equal to 24 | 20 | 1 |
(c) \( \boldsymbol{0.6} \)