QUESTION IMAGE
Question
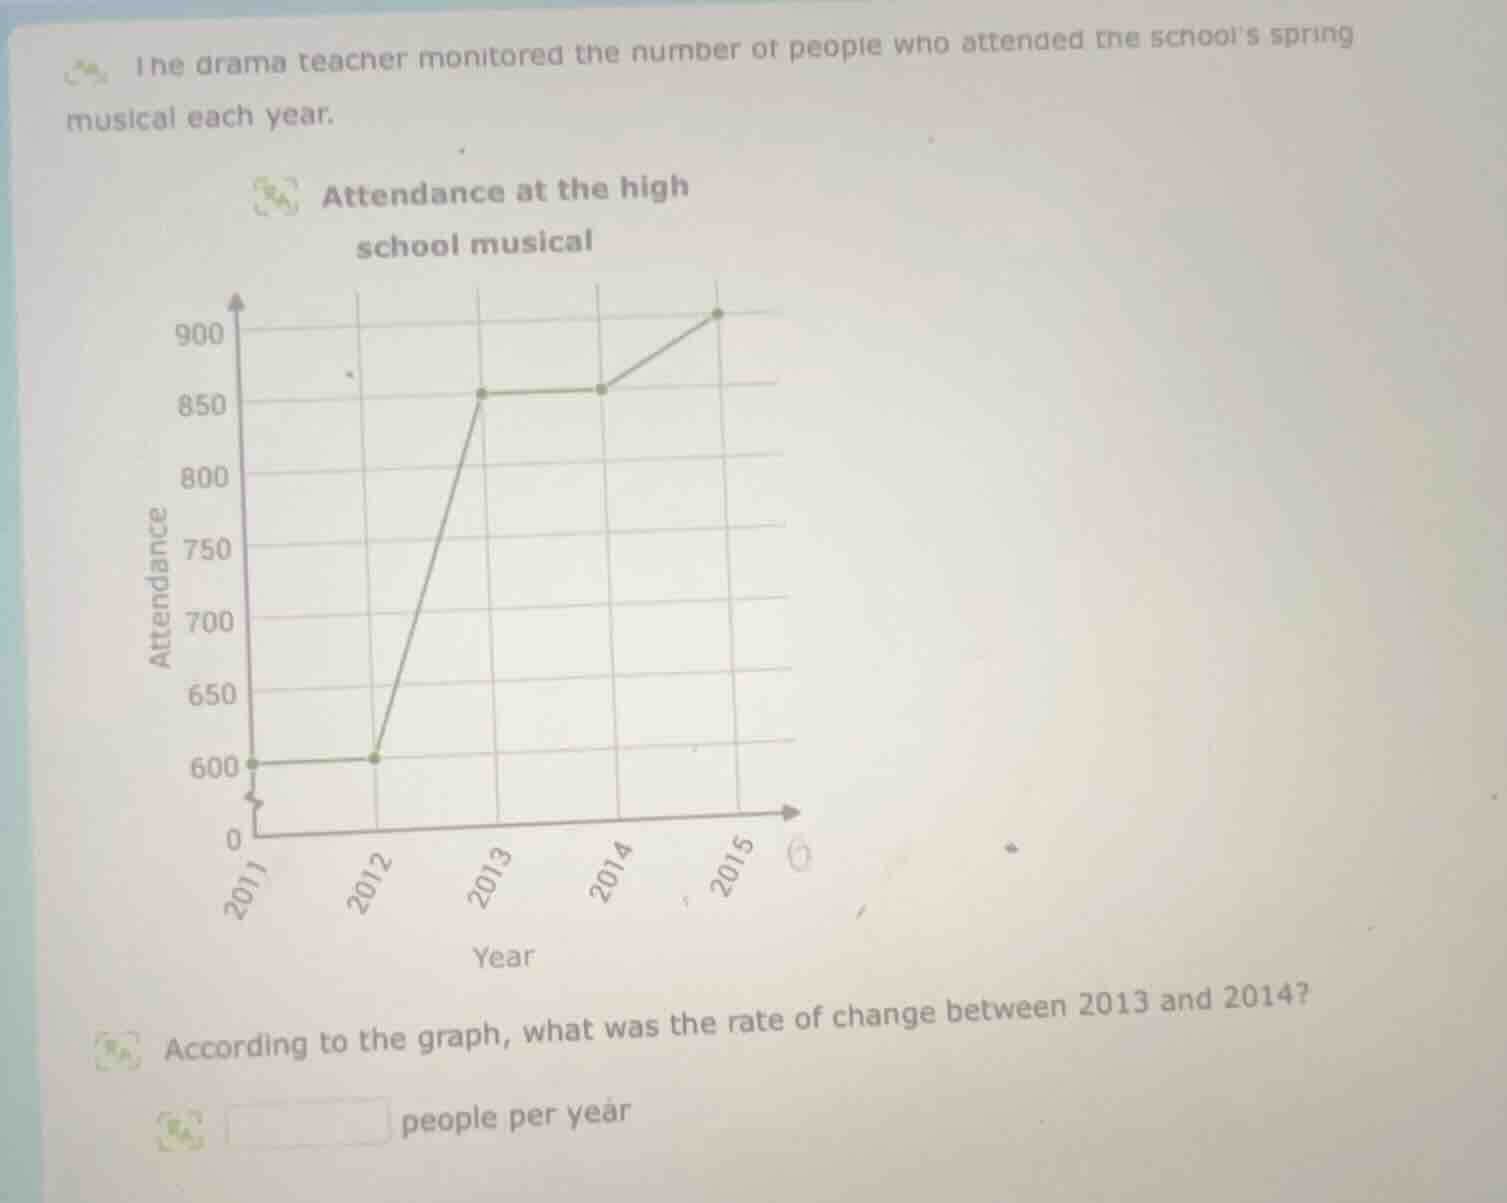
the drama teacher monitored the number of people who attended the schools spring musical each year.
attendance at the high school musical
according to the graph, what was the rate of change between 2013 and 2014?
____ people per year
Step1: Identify attendance in 2013 and 2014
From the graph, attendance in 2013 = 860, attendance in 2014 = 860
Step2: Calculate rate of change
Rate of change = $\frac{860 - 860}{2014 - 2013} = \frac{0}{1} = 0$

Snap & solve any problem in the app
Get step-by-step solutions on Sovi AI
Photo-based solutions with guided steps
Explore more problems and detailed explanations
0